To save this page as a PDF, click this button and choose the PDF destination.

Biotransport diagnostics and therapeutics

15:10 - 16:40 Tuesday, 10th July, 2018

Liffey MR3

Track Biofluid and Transport

Posters for this session are on display on Tuesday 10th July in Liffey A.

Chairs: Rupak Banerjee and Liang Zhu

P2566 Using Turing instabilities to model the effects of ischaemic stroke

Mr George Qian, Dr Stephen Payne
University of Oxford, Oxford, United Kingdom

Abstract

Stroke is a condition that affects over 15 million people worldwide every year. There are two types of stroke: ischaemic, which is the more common and occurs when blood supply to the brain is blocked, and haemorrhagic, where blood vessels in the brain burst, causing bleeding. After the occurrence of an ischaemic stroke, one typically observes three regions being formed, namely the ischaemic core, penumbra and the unaffected region. While cells in the ischaemic core die immediately due to lack of blood supply, there remains a chance to salvage those in the penumbra, as these cells are still supplied temporarily by peripheral vessels.

Where to place the borders demarcating these three regions is an issue that many researchers have investigated, yet with limited success. To this end, our goal is to create a mathematical model that uses cell calcium ion concentration as a biomarker to predict cell survival rates in these three regions of the brain, given some decrease in blood flow, a clinically measureable input. This would allow our model to be used as a diagnostic tool for clinicians to determine which areas to apply reperfusion.

We find that our model is able to portray certain spatial inhomogeneities known as Turing patterns, which arise from diffusion-reaction equations satisfying certain conditions. Specifically, the patterns occur when the system is linearly stable in the absence of diffusion but unstable in its presence. A further condition arises from the boundary conditions: only certain modes are admissible for a specific set of domain and boundary conditions. We can find, subsequently, a set of parameter values satisfying these criteria.

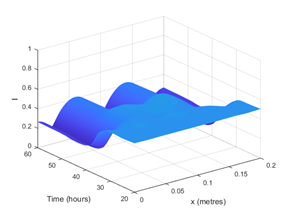
Hence, with only one set of differential equations expressing calcium concentrations as the sole biomarker, we are able to show that the resulting simulations can form spatial inhomogeneities. An example of this is shown in Figure 1, where we plot the injury (I) profile over space and time: this variable is our measure of cell damage to different regions of the brain. The results show that a region of instability is found under these particular conditions.

This is a feature that, to our knowledge, has not been investigated in other models on ischaemic stroke. The presence of Turing patterns allows us potentially to model the ischaemic core, penumbra and unaffected regions; however, the spatial inhomogeneities observed in our model simulations do not yet correspond to these regions due to the effects of higher-order modes. We, therefore, intend to further investigate this behaviour and to expand the model in order to relate it to clinical data in the future.
Uncaptioned visual


P2567 Intravascular Membrane Catheter for CO2 Reduction: In Vitro Tests and First Results

Christoph Janeczek1, Alen Karabegovic1, Florentine Huber-Dangl1, Michael Harasek1, Benjamin Lukitsch1, Claus G. Krenn2, Roman Ullrich2, Reinhard Willinger1, Margit Gföhler1
1Technische Universität Wien, Vienna, Austria. 2CCore Technology, Vienna, Austria

Abstract

Introduction

CO2 reduction in the venous blood is a main challenge when treating pathological respiratory deficits in critical care medicine [1]. The aim of this study is to develop a minimal invasive catheter device for this task, the so-called minimal invasive liquid lung MILL. Main advantage of the MILL catheter device is that no blood needs to be extracted from the body to fulfill its function of CO2 reduction in the blood flow in the Vena Cava. Additionally MILL uses a biocompatible liquid as a sweep fluid for absorption of CO2 from the blood in the catheters membrane.


Methods

Central part of the intravascular MILL catheter is a hollow fiber membrane module which is inserted into the Vena Cava for CO2 removal from blood. A miniature blood pump powered by an electrical motor is placed directly at the inflow to the membrane module to compensate the pressure drop and to provide the required blood flow rates between 0.7 and 1.2 l/min for the diffusion process through the membrane module. The sweep fluid for CO2, a Perfluorcarbon (PFC) liquid, is pumped in a closed circuit and purged in an extracorporeal console. For in vitro tests on the pump performance and hydraulic behavior of the system a test circuit and an implemented simplified artificial Vena Cava was installed. The amount of CO2 diffusion is controlled by the flow rates of PFC, blood and purge fluid.


Results

First tests have shown that the developed micro pump with a casing diameter of 8.5 mm and a rotational speed up to 32000 rpm can provide the membrane module with the required blood flow from 0.7 to 1.2 l/min for CO2 diffusion by overcoming the pressure difference in the membrane module. The hydraulic behavior of the catheter prototype with a maximum length of 230 mm and a diameter of 14 mm placed in the artificial Vena Cava was determined by measuring the pressures and flow rates at specific positions like the inlet and outlet of the system in the test loop for different blood flow ratios.


Discussion

Dynamic behaviour of the membrane based minimal invasive catheter device MILL for CO2 removal from blood has been successfully tested in-vitro. In the next step, gas diffusion in the membrane module will be optimized and the test circuit will be extended accordingly. Also blood damage due to the mechanical load on the blood cells while passing the catheter will be determined as a crucial parameter for successful application of the device.


References

[1] Matthay MA et al (2012), J. o. Clinical Investigation. 122(8):2731-2740.

P2568 Design of RF Thermal Plasty Balloon for Conformal Atherosclerosis Treatment

Mr Shiqing Zhao, Prof. Aili Zhang, Prof. Lisa X. Xu
Shanghai Jiao Tong University, Shanghai, China

Abstract

Atherosclerosis, the narrowing of the blood vessels, is a life threatening disease. Percutaneous Transluminal Angioplasty (PTA) and stenting are the major treatment. Inflation induced mechanical forces and the serious proliferation of smooth muscle cells resulted in a high rate of restenosis, several months after PTCA. [1] 

A selective treatment of the occluded vessel walls with ablation of the plaque, suppression of the smooth muscle cell proliferation while protecting the endothelial layer should result in a better therapeutic outcome. Thermal energy has been proved to serve as minimal invasive knives for many diseases. Thus to realize this selective treatment of the atherosclerosis, especially for the typical plaques [2] shown in Figure 1A, a thermal plasty balloon was proposed. By combining the volumetric RF heating with convection cooling on the inner surface, a conformal treatment region may be reached. More importantly, through the special design of the RF electrodes and selection of the cooling rate, the incomplete endothelium may be protected, the SMC proliferation ability be eliminated with the occluded blood vessel be opened.

To evaluate the feasibility of this RF thermal plasty Balloon, a 3D numerical model was developed to simulate the heating process of the device with RF electrodes designed and effective convection rate selected to adjust the special shape of the plaque for treatment. The RF field was described using the quasi-static Electrostatic equation. The absorbed energy of RF was treated as heat source in thermal conduction equation. The dependence of the electrical conductivity of the tissue was measured through fitting with experimental measurements.

For the concentric crescent plaque (see figure 1A, left five), the thermal plasty balloon with a set of electrodes with the shape shown in figure 1B were designed. The cooling agent was delivered into the balloon and serves as cooling convection to the inner surface of the vessel wall.  

When the convective coefficient of 1000W/(m2K), cooling agent is set to be 20 oC, RF voltage being 20V, after 4s heating, the heating region are shown in Figure 1C. The results clearly show the highest temperature region locates in a center away from the inner surface of the vessel and is quite similar to the concentric crescent plaque. This means the endothelium layer would be spared in the treatment. Besides, by change of the voltage, size and the interval of electrodes, the temperature and convective coefficient of cooling agent, the heated region could be adjusted. With the same model, several other sets of electrodes are designed and together with a careful selection of convection rate, a shape of ablation range for other plaques can also be realized.
Uncaptioned visual[1] R. Ross, Nature, vol. 362(1993), pp. 801

[2] Stary, H. C.Virchows Archiv 421.4 (1992),pp. 277


P2569 White matter hydraulic permeability from electron microscopy images

Mr Marco Vidotto1, Mr Michele Gazzara1, Ms Daniela Botnariuc2, Mr Andrea Bernardini3, Prof Daniele Dini3, Prof Elena De Momi1
1Politecnico di Milano, Milan, Italy. 2Faculty of Sciences of the University of Lisbon, Lisbon, Portugal. 3Imperial College London, London, United Kingdom

Abstract

Introduction

Convection-enhanced delivery (CED) is a surgical technique, used with invasive brain tumours, that consists in injecting, directly into the parenchyma, therapeutics. Predicting their distribution inside the tumour is crucial to optimize the infusion point and the flow rate. Indeed, the parenchyma can be considered as a porous media with the neurons immersed in the interstitial fluid. However, the relationship between the axons geometry and the convective part of the flux, which drives the drug through the brain, is currently unclear. To shed light on this aspect of CED, this paper proposes a numerical method to compute the hydraulic permeability starting from axons electron microscopy (EM) images.

Methods

The EM images where acquired from data provided by [1] and obtained for a monkey brain in the corpus callosum (CC) and superior fascicle (SF). Manual segmentation separated the axons from the extracellular matrix and the interstitial fluid. Then, they were imported in the finite element software ANSYS to compute velocity and pressure fields of the fluid moving through the pores. Since in CED intervention the flow rate is very low, in first approximation we can neglect the tissue deformation and therefore model the axons as rigid. This procedure evaluates the permeability (k) by means of Darcy’s law:

v=k∇p/μ,

With:
v fluid averaged velocity in the porous medium
μ viscosity
∇p pressure loss across the volume.

Results

Fig. 1A shows segmented samples, while in Fig. 1B it is shown how increasing the size of the Representative Volume Element (RVE) considered, a better estimate of the permeability is obtained for both SF and CC. To avoid possible errors due to edge effects and boundary conditions, RVEs of 10 (SF) and 12 µm (CC) representative length were used to obtain the permeability values reported in Fig. 1C.
Uncaptioned visual
Fig. 1: (A) Manual segmentation: axons (white), interstitial fluid (black). (B) Permeability as a function of the RVE size. (C) SF and CC permeability boxplot for RVEs of 10 and 12 µm respectively.

Discussion

In this study, we have shown the feasibility of using a numerical method to compute the hydraulic permeability in the brain with results in very good agreement with experimental data found in literature [2]. This work can be considered as a first step towards a more comprehensive understanding of how the drug delivery depends on the microstructure.

Acknowledgements

This project has received funding from the European Union’s Horizon 2020 research and innovation programme under grant agreement No 688279.

We kindly thank Dr. Almut Schüz (Max Planck Institute for Biological Cybernetics) for providing the images dataset.

References
[1] Liewald, D., et al., (2014). Biol Cybern, 108(5): 541-547
[2] Tavner, A.C.R., et al., (2016), J Mech Behav Biomed Mater, vol. 61, pp. 511-518


P2570 Characterization of microvascular malformations based on a computational hemodynamic analysis

Sabrina Frey1, Tarcisi Cantieni1, Axel Haine2, Rafael Kammer2, Hendrik von Tengg-Kobligk3, Dominik Obrist1, Iris Baumgartner2
1ARTORG Center for Biomedical Engineering Research, University of Bern, Bern, Switzerland. 2Swiss Cardiovascular Center, Division of Angiology, University of Bern, Bern University Hospital, Bern, Switzerland. 3Department of Diagnostic, Interventional and Pediatric Radiology, University of Bern, Bern University Hospital, Bern, Switzerland

Abstract

Introduction

Arteriovenous malformations (AVMs) are a congenital vascular pathology characterized by anomalous blood vessels connecting arteries and veins and bypassing the capillary bed4,5. Peripheral malformations in large blood vessels can be visualized with current clinical imaging modalities. Their clinical6 and hemodynamic2 consequences have been studied extensively. However, when AVMs are in the peripheral microcirculation, their angioarchitecture is unknown4. In this study, we aim at determining the microvascular origins of pathological arteriovenous contrast-agent (CA) transport patterns. We developed a computational model to investigate the effects of hypothesized microvascular malformation morphologies on macroscopic CA-transport.

Methods

Clinical angiographies are analyzed by sampling time-contrast intensity curves of feeding arteries and draining veins. To characterize the transport properties of the intervening vasculature, we employ a differential operator fitted to the measured input and output curves. The operator is composed of a time lag and a dispersive element shaped as a skewed unimodal density function1. The first and second central moments of the operator describe the delay of CA-arrival between the sampling points and the dispersive characteristics of the vasculature.

A similar analysis is performed for computational models of microvascular malformations to relate the clinical measurements to specific microvascular malformation morphologies. The computational model (Figure 1) consists of a capillary bundle with feeding arterioles and draining venules based on statistical data for skeletal muscle microcirculation3. We introduce a set of hypothesized morphological anomalies, such as arteriolo-venulous6 and capillary-venulous microfistulae. We compute blood flow rates and pressures with a lumped parameter description of the network, which allows for the systematic analysis of many different malformation morphologies2.

Uncaptioned visual

Results and Discussion

Retrospective analysis of patients diagnosed with a microvascular malformation shows that the differential transport operator with appropriate shaping parameters can describe CA-transport processes in the involved vascular compartments. We observe two distinctive CA-transport patterns: 1) patients exhibiting short delay values and low CA dispersion, and 2) patients showing a long delay and highly dispersive transport characteristics. These patterns were also observed in the model networks, where fistulae on the level of arterioles and venules result in small mean and variance of the transport operator, while fistulae on smaller scales exhibit the opposite effect. These results are in good agreement with clinical observations and underline the potential of the presented method for the analysis of complex microvascular anomalies.

References

[1] Bassingthwaighte J.B. et al Circ Res (1970) 27:277–291.

[2] Frey S. et al. Ann Biomed Eng (2017) 45:1449.

[3] Skalak T.C. et al. Microvascular Research (1986) 32(3):333-347.

[4] Stein M. et al. Plast Reconstr Surg Glob Open (2014) 2(7):e187.

[5] Yakes W. et al. Gefässchirurgie (2014) 19:325–330.

[6] Yakes W. et al. Springer Milan (2015) 263–276.


P2571 Towards a flow independent severity index to assess calcific aortic valve stenosis: modeling the unsteady effects

Megan Heitkemper, Hoda Hatoum, Juan Crestanello, Lakshmi P. Dasi
The Ohio State University, Columbus, USA

Abstract

Introduction
Aortic heart valve replacement due to aortic stenosis (AS) is the second most common cardiac operation performed in the US1. The parameters most frequently used to assess AS severity are the transvalvular pressure gradient (TPG) and the effective orifice area (EOA), which represents the minimum cross-sectional area of the jet downstream2. Currently the use of indices that depend on flow to characterize AS severity can plague the timing of interventions in patients, particularly when the data are discordant such as those with low flow and low TPG. Previous attempts towards a flow independent severity index, including the formulation of energy loss based indices3, could still lead to inaccuracies under different unsteady flow conditions (systolic durations, heart rates etc.). The objective of this study is to develop a model that captures valve area changes due to unsteady effects of flow.

Methods
High fidelity flow and TPG were measured in stenotic and non-stenotic valves across four different cardiac output (CO) conditions (1,3,5,7 L/min) in a left heart simulator flow loop. Valve area defined by the leaflet free edges throughout systole were computed from high-speed imaging data, and particle image velocimetry was performed to measure the turbulent jet velocity.

Results and Discussion
Results confirmed that in addition to CO, valve area was strongly dependent on: (a) dUncaptioned visual/dt where Uncaptioned visual is the main jet velocity, yielding different opening areas for the same velocity in systole and diastole (Fig.1); and (b) a stiffness property of the calcified leaflets. Momentum balance for a control volume encompassing the valve illustrated that a dynamic force, F, acting on the valve leaflets is dependent on dUncaptioned visual/dt , which can further open the leaflets during diastole. It can be shown that F = P1A1 – P2A2 –M(dUncaptioned visual/dt) where P1 and P2 are the ventricular and aortic pressures respectively, A1 and A2 are the areas upstream and downstream the valve respectively, and Uncaptioned visual is the fluid mass within the control volume. Recognizing that the valve area is related to F, in addition to applying Bernoulli’s equation with friction losses, a relationship was derived between the area of the valve opening, the main jet velocity, and the unsteady term dUncaptioned visual/dt. The modeled area exhibits the same unsteady characteristics seen in the experimental results, again yielding different opening areas for the same velocity in systole and diastole. To this end, the unsteady behavior of a calcified aortic valve was successfully modeled and validated.
Uncaptioned visual

Acknowledgements
The research reported was supported by National Institutes of Health (NIH) under Award Number R01HL119824.

References
[1] Mozaffarian, D., et al., Circulation, 2015.
[2] Shavelle, D.M., et al., Cardiology, 2000.
[3] Garcia, D., et al. JBME, 2005.


P2572 Factors influencing blood electrical conductivity at Couette flow

Dr. Ivan Ivanov1,2, Prof. Nadia Antonova3
1Institute of Experimental Morphology, Pathology and Anthropology with Museum, Sofia, Bulgaria. 2National Sports Academy, Sofia, Bulgaria. 3Institute of Mechanics, Sofia, Bulgaria

Abstract

Introduction

Different factors as shear rate, red blood cells (RBC) orientation in shear planes, hematocrit, RBC aggregation and sedimentation and temperatures determine blood’s rheological behavior and electrical properties. The aim of this study is to estimate these factors influencing blood electrical conductivity at Couette flow in direction parallel to the shear planes. The knowledge of these factors leads to better understanding of the processes occurring when blood flows in different conditions.

Methods

The experiments were carried out with a rotational viscometer LS 30 Contraves, equipped with a device with software for measurement of the electrical conductivity (σ) simultaneously with the measurement of blood rheological properties [1, 2]. Normal blood from healthy subjects, conserved with CPD-A1 conserving agent is used. The blood samples were tested at different shear rates, temperatures (25 and 37˚C), hematocrits and flow conditions.


Results

At rest, RBCs are disoriented in the measurement gap and the blood electrical conductivity σ is higher as a result of lack of erythrocyte orientation and available RBC aggregation. When shear forces are applied by rotation of the outer cylinder, processes as RBCs orientation, RBCs disaggregation, RBCs rotation and RBCs deformation at higher shear rates are induced. Whole blood viscosity (WBV) decreases with the shear rate increase and increases at higher hematocrit (Hct) and lower temperature.

Uncaptioned visual

                                        Fig. Blood conductivity in time.

Discussion

The results indicate that time course of blood conductivity is influenced by factors as shear rate, red blood cells orientation in shear planes, hematocrit, RBC aggregation  and sedimentation, different temperatures and flow regimes. The time transformations of the blood’s inner structure lead to different blood sample rheological behavior [3]. This results in change of the electrical current path between the measurement electrodes, which are inserted in the outer cylinder wall of the Contraves viscometer. The obtained value of blood electrical conductivity in time opens possibilities for smart dissection of the processes in flowing blood. The simultaneous estimation of blood electrical and rheological properties gives a base for analyses, which are important for understanding the factors defining rheological blood behavior.        

Acknowledgements

The work was supported by the Operational Programme “Science and Education for Smart Growth” 2014-2020, co-financed by the European Union through the European Structural and Investment Funds, Grant BG05M2OP001-2.009-0019-С01 from 02.06.2017.

References

1. Antonova, N., Riha, P., Ivanov, I., 2008. Time dependent variation of human blood conductivity as a method for an estimation of RBC aggregation. J. Clin. Hemorheol. Microcirc. 39, 69–78.

2. Ivanov, I., 2016. Calibration of a system for simultaneous measurement of rheological and electrical liquid properties, Scientific Proceedings  Year XXIV, Number (187) June 2016, 415-417.

3. Ivanov, I., 2017. Whole blood viscosity changes at coagulation under Couette flow, Proceeding Book ISCASS, 304-307.


15:10 - 15:30

O0938 Medical imaging and diagnostics for economically disadvantaged countries and people in poverty: Electromagnetic technology and cellular phone diagnostics

Boris Rubinsky
University of California, Berkeley, USA

Abstract

Abstract not available

15:30 - 15:50

O0939 Arterial wall oxygen transport and vascular disease revisited

Professor Emeritus Colin G. Caro1, Professor John M. Tarbell2
1Imperial College, London, United Kingdom. 2The City College of New York, New York, USA

Abstract

We review the mechanisms of oxygen transport to blood vessels in the context of vascular disease with emphasis on intimal hyperplasia (IH) associated with atherosclerosis (ATH) and vascular stents.

Oxygen is highly permeable to endothelial cells lining blood vessels and diffuses readily through the matrix layers of the vessel wall suggesting that these structures do not limit oxygen transport. The two limiting mechanisms for oxygen transport appear to be:  blood phase resistance that is greatly influenced by vessel geometry and controls oxygen transport to the inner layers of the wall1, and transport from the vasa vasorum (VV) - microvessels in the adventitia and outer media that supply oxygen to the outer layers of the wall2.

Oxygen electrode measurements demonstrated that the carotid bifurcation is hypoxic in regions where atherosclerotic plaques localize and more recent electrode studies have demonstrated hypoxia around vascular stents that is exacerbated in stents that are over-expanded3.   Computations of oxygen transport rates from blood to the arterial wall in atherogenic geometries have predicted regions of inner wall hypoxia where disease localizes4. It has been suggested that stent insertion compresses VV and limits oxygen transport to the outer wall5, a mechanism that would be exaggerated when stents are over-expanded.  The proposal that wall hypoxia plays a role in the development of IH is supported by observations that oxygen supplementation following arterial stenting reduces IH.

To address oxygen transport limitations associated with stents, Caro developed a self-expanding stent with three-dimensional helical-centerline geometry6. This stent induces secondary flows that alter the circumferential distribution of blood phase resistance to oxygen transport that on (circumferential) average increases the transport rate to the inner layers of the wall compared to a straight stent2. Recent experiments in common carotid arteries of pigs comparing the performance of helical stents to otherwise identical straight stents showed a significant reduction of IH associated with helical stents6.

Of additional interest is that medial tone may be assessed by measurement of arterial pulse wave velocity (PWV) that is proportional to vessel tone. Increased PWV and tone may lead to compression of VV and hypoxia. Factors increasing PWV include cigarette smoking 7, and hypertension - significant risk factors for ATH/IH that may be related to insufficient VV oxygen transport. We conclude that hypoxia should be addressed in the treatment of ATH and IH.

References  

1. Tarbell J.M. (2003) Ann. Rev. Biomed. Eng.

2. Coppola G. & Caro, C.G (2009) J. Roy. S. Interface

3. Santilli S.M. et al. (1992) Hypertension

4. Tada S. & Tarbell J.M. (2006) Ann. Biomed. Eng.

5. Cheema A.N. et al. (2006) J. Am. Coll. Cardiol.

6. Caro C.G. et al. (2013); J. Roy. Soc. Interface

7. Caro, CG et al (1987), The Lancet


15:50 - 16:00

O0940 Microbubble dynamics under ultrasound steering: Bjerknes, drag, and lift forces in the macrocirculation

Alicia Clark, Alberto Aliseda
University of Washington, Seattle, USA

Abstract

Introduction

The feasibility of ultrasound as a means of steering ultrasound contrast agents (UCAs) through vasculature for clinical applications such as thrombolysis and targeted drug delivery in small capillaries has been actively investigated over the last two decades. The trajectories of UCAs can be manipulated by utilizing the Bjerknes force, caused by an external fluctuating pressure field at frequencies matched to the bubbles' resonant frequencies. Although the mechanism causing this force is well understood, there is a gap in understanding of the coupling of ultrasound-induced forces with hydrodynamic forces when microbubbles are immersed in a large Reynolds number, pulsatile flow. Manipulating these microbubbles in large arteries or veins has potential to target specific areas of the body by biasing bubbles injected systemically towards certain paths in the vasculature.

Methods

Microbubbles in steady, fully-developed flow over a range of physiologically-realistic Reynolds numbers and under pulsatile flow conditions with matching Reynolds number and varying Womersley numbers are imaged inside a straight cylindrical flow phantom by a high-speed camera with a long distance microscope lens. The location of each microbubble is extracted by image post-processing and given as input to our particle tracking algorithm to reconstruct the trajectory of each microbubble in the flow. Steady and pulsatile flow experiments are also conducted in a patient-specific, index of refraction matched carotid artery flow phantom to explore the application of ultrasound to steer microbubbles towards a selected downstream branch. 

Results

We have quantified experimentally the acoustic and hydrodynamic forces acting on insonified microbubbles in both uniform and pulsatile flows at a range of physiologically relevant Reynolds and Womersley numbers. Microbubble velocities and accelerations computed from the long-time trajectories are statistically correlated against the bubble position in the vessel and phase of the cardiac cycle. From these distributions of values, the statistics of the forces acting on the microbubbles, including the Bjerknes, lift, drag, and added mass, are calculated. The relative scaling of the Bjerknes force to the hydrodynamic forces is calculated by comparing the values obtained for different acoustic frequencies and amplitudes, and pulse repetition frequencies (PRFs) while keeping the base flow constant.

Discussion

The Bjerknes force scaled with the square of the acoustic amplitudes for both steady and pulsatile flow conditions. The ratio of Bjerknes to drag force decreased with increasing Reynolds number quantifying the threshold for a clinically relevant steering force in large to small arteries. The shear-induced lift force, the only hydrodynamic force that is perpendicular to the flow direction, and thus competing with the Bjerknes force in these experiments showed a highly counter-intuitive behavior, switching direction with the presence of acoustic oscillations.

Uncaptioned visual


16:00 - 16:10

O0941 Assessment of Enhanced Thermal Effect due to Gold Nano-Particles during MR-guided High Intensity Focused Ultrasound (HIFU) Procedures using a Mouse-Tumor Model

Mr Surendra Devarakonda1, Ms Maria Lehn2, Dr Edith Janssen2, Dr Keith Stringer2, Dr Matthew Myers3, Dr Rupak Banerjee1
1University of Cincinnati, Cincinnati, USA. 2Cincinnati Children’s Hospital Medical Center, Cincinnati, USA. 3U.S. Food and Drug Administration, Silver Spring, USA

Abstract

Introduction

High-intensity focused ultrasound (HIFU) is a non-invasive procedure to treat malignant tumors. However, collateral damage due to the use of high acoustic powers (>250W) during HIFU procedures has remained a challenge. In this in vivo study, the utility of using gold nano-particles (gNPs) during HIFU procedures has been assessed to evaluate thermal enhancement at low powers, thereby reducing the likelihood of collateral damage.

Methods

Tumors were grown using melanoma tumor cells (B16/F10) subcutaneously on the right flanks of 24 mice (C57Bl/6). Physiologically relevant concentrations (0% (control), 0.0625%, and 0.125%) of gNPs were injected directly into the tumors. Sonications at acoustic powers of 10, 20, and 30W were performed for a duration of 16 sec using an MR-HIFU system. At each power level (10, 20, and 30W), the measured temperatures were averaged over three trials (n=3), except for three cases (0.0625% gNPs – 10 and 30W, and 20W for 0.125% gNPs) where n=2. The missing data were imputed using a statistical software (‘MICE’ package in ‘R’). Tumor histopathology with H&E stains in presence and absence of gNPs was also performed.

Results

Figure 1A shows the thermal maps of the temperature variation for the concentrations of 0%, 0.0625%, and 0.125% gNPs and for the powers of 10, 20, and 30W at the plane of maximum pixel temperature. An increase in temperature (red pixels) can be seen from top to bottom with increase in concentration of gNPs.

Uncaptioned visual

For 10W, the increase in temperature rise relative to 0% gNP’s are 32.9% and 69.3% for the 0.0625% gNPs and 0.125% gNPs, respectively (Fig. 1B).  The increases relative to baseline are 17% and 124% for the 0.0625% and 0.125% gNP values, respectively, for 20W.  For a power of 30W, the increase relative to baseline is 30.3% for the 0.0625% concentration and 82.7% for the 0.125% concentration. Statistical significance (p<0.05) can be seen for the 0.125% concentration and for powers of 20W and 30W. Cell necrosis (Fig. 1C) at the interface with soft tissue (clefting, hemorrhage and misshapen nuclei) was seen in the tumor with gNPs, while, the necrosis was absent in control tumor (Fig. 1D).

Discussion

A first step in determining the efficacy of gNP introduction in thermal ablation procedures is quantification of temperature rise in a realistic tumor environment.  This study showed that introduction of gNP’s at a concentration of 0.125% produced a significant thermal enhancement relative to no nanoparticles, for acoustic powers of 20W and 30W.  For example, at 20W power, the observed temperature of roughly 70 degrees would result in instantaneous cellular necrosis, compared with about 15 seconds for the procedure without gNP’s.  Such a time savings can be valuable in actual procedures, which involve a distribution of many exposures.

16:10 - 16:20

O0942 Thermoregulatory Manipulation to Reduce Overnight Blood Pressure without Drugs

Mr. Shahab Haghayegh, Dr. Sepideh Khoshnevis, Professor Kenneth Diller
University of Texas, Austin, USA

Abstract

Introduction:

An overnight drop in blood pressure is known to be prophylactic for cardiovascular diseases (CVD)1. For normal sleepers, the BP decreases to its circadian cycle nadir during nighttime2. Vasodilation of the large arteriovenous anastomoses (AVA) in glabrous skin leads to a reduced peripheral vascular resistance, producing a desired overnight dip in mean arterial pressure. The palmar and plantar glabrous skin regions have a dense AVA network and function as primary heat transfer portals for the body3. When vasodilated at sleep onset, these AVAs can facilitate a drop in core temperature requisite to quality sleep by facilitating convective heat flow between the core and periphery. Mild neck and spinal heating (Selective Thermal Stimulation, STS) can produce on-demand vasodilation of AVAs, thus promoting blood flow to glabrous skin regions3 and increasing convective heat dissipation through those areas. Simultaneous mild cooling of the central environment of the body contributes to lowering the core temperature during sleep, while a relatively warm peripheral environment for the hands and feet encourages continuing AVA vasodilation for rejecting body heat and facilitating an overnight dip in the arterial blood pressure.


Methods:

A novel dual temperature zone mattress for a single sleeper has separate circulating fluid flow systems for cooling the central region and warming the peripheral region of the bed under independent control. STS heating is applied through the pillow under a third separate control pattern that is activated only during the sleep onset period. Four healthy young males participated in two nights of sleep, one with STS and a dual temperature environment (STS sleep) and one as a control. Subjects were challenged to go to sleep two hours earlier than their normal time to test the ability of STS to modify sleep onset on demand. The glabrous skin blood perfusion and MAP were measured continuously and compared between the two nights.


Results:

Fig 1. shows that MAP dropped more rapidly and by a larger magnitude for STS sleep than for control sleep. A reduced MAP overnight enables the cardiovascular system to achieve a reduced risk factor for morbidity and mortality2. Further, glabrous skin perfusion increased more rapidly and to a greater extent during the STS sleep compared to control sleep.

Uncaptioned visual


Discussion:

The combination of STS applied at sleep onset and a dual temperature environment produce physiological responses consistent with achieving effective sleep that leads to better long-term health. Separate measures also show sleep onset time can be advanced and sleep quality can be enhanced with this thermal technology.


References:


[1] Hermida, RC. et al., American Journal of Hypertension. 2012;25(3):297-305.

[2] Hermida, RC. et al., Chronobiology International. 2002;19(2):461-81.

[3] Diller, KR., Advances in Heat Transfer. 2015;47:341-96.


16:20 - 16:30

O0943 Numerical model of the drug carrier transport during targeted drug delivery for liver cancer: a feasibility study

Prof. Charlotte Debbaut, Ms. Ghazal Adeli Koudehi, Prof. Patrick Segers
Ghent University, Gent, Belgium

Abstract

Introduction:
Hepatocellular carcinoma (HCC) is the third leading cause of cancer-related deaths worldwide. Unresectable HCC’s are currently treated using local injections of chemotherapeutics or radioactive particles during transarterial liver catheterization. This strategy may increase local drug concentrations near tumorous tissue, while limiting the systemic toxicity compared to conventional chemotherapy. Though promising, the optimal treatment conditions (injection location, dose...) are still unknown. As the vasculature feeding the tumor plays a key role, this study focuses on exploring the added value of computational models to optimize targeted drug delivery for HCC.

Methods:
A patient-specific hepatic arterial geometry was obtained from micro-CT data of a human liver [1]. The 3D reconstruction was truncated at the 4th blood vessel generation and an inflow extension was added (Fig. 1a). The volume mesh counted 8.9 million elements. Computational fluid dynamics calculations were performed using Fluent (Ansys, USA) to simulate both the blood flow (continuous shear-thinning fluid phase; viscosities estimated using Quemada model) and drug transport (discrete phase) in the liver. Particle tracking allowed calculating the trajectories of individual drug carriers through the flow field. Baseline boundary conditions included a velocity inlet of 0.155 m/s at the hepatic artery, while the outlet flow distribution was estimated using Murray’s law. Particles were released using a uniform surface injection of 104 particles. A sensitivity study was performed to study the impact of relevant parameters (injection velocity, particle size…) on the particle distribution.

Results and discussion:
The results were analyzed using particle release maps of the injection plane (Fig. 1b), in which each color represents the injection locations to target one specific outlet. Results showed that the cross-sectional injection location has a huge impact on the particle distribution, as also found in [3]. A good choice of this parameter may allow targeting a specific outlet (Fig. 1b-c). Other parameters having a significant impact on the particle distribution, are the position of the injection plane (Fig. 1c; proximal versus distal placement of the catheter), the particle density (1600-3600 kg/m³), and the particle diameter (40-100 µm), leading to changes in the outlet-specific number of exiting particles up to ± 64%, 61%, and 79%, respectively. In contrast, variations of the injection velocity (0.1-0.2 m/s) had only little impact (up to ± 6%).

This feasibility study indicates the potential of patient-specific computational models to optimize targeted drug delivery for liver cancer [2]. Future work will focus on validating the numerical modelling approach and testing it in a cohort of HCC patients that received transarterial therapy.

References:
[1] Debbaut, C. et al., 2014. Journal of Anatomy. 224(4), p509-517.
[2] Koudehi, G.A., 2016. Masterthesis, Ghent University.
[3] Aramburu, J., 2016. Int J Numer Method Biomed Eng. 26(1), p807-827.


Uncaptioned visual