Introduction
Computer-aided-design (CAD), computer-aided-engineering (CAE), and finite element analysis (FEA) are becoming indispensable tools in mechanical and biomechanical engineering. Creating a three-dimensional geometry is the initial step for performing FEA of complex structures such as bones. This has been done by several methods, primarily from CT-MRI images [1]. However, what if either CT-MRI images are not available or bones are shattered? The aim of this study was to find novel ways to build a unique 3D model of a bone in two different cases. Firstly, considering a bone and using a 3D scanner device; and secondly, considering 2D scanned images of cross sections (slices) of a bone and reconstructing its diaphysis. A hypothesis as to whether FEA could be performed following the generated geometries was explored.
Methods
An Artec Eva 3D-scanner was employed to create a 3D-model of an equine third metacarpal bone. This scanner is a good choice for making rapid and precise 3D models of complex objects such as bones. Not only was the scanner portable but also it allowed for contactless measurements. The captured cloud of points was imported into CAD and a continuous mesh was created. The mesh was converted into surfaces, from which a solid structure of the bone was created. Continuous spline-curves were created on the inner and outer edges of the cortex, and a surface was created for each slice. The inner and outer surfaces of the bone were then created, and ultimately, a solid model of the diaphysis was constructed. For both cases importing the models into CAE and performing FEA were promising.
Results and Discussion
Fig.1 depicts the geometries created by these methods. 10-node tetrahedron elements (quadratic) were applied and FEA was performed to obtain stress and deformation. Fig.2 displays both the procedures taken for creating the diaphysis of fractured bone and the results of stress and deformation. The possibility of modifying slices and creating the whole geometry of a bone is a great advantage of working with spline-curves, and this method can be recommended as an alternative way to create biomechanical models for engineers working with CAD software only. Since CT-MRI CAD-packages require intact bones and their segmentations, this study highlighted a method to reconstruct a shattered bone from its pieces and the advantages of optical 3D digitizing to provide a base to work on different shapes that will allow investigation of slight shape differences in individual bones. These processes are recommended for use in biomechanics [2] and forensic science [3].
References
[1] Tuan, H., et al. (2005). Computer-Aided Design, 37(11): 1151-1161
[2] Groesel, M., et al. (2009). Journal of Biomechanics 42(12): 2006-2009.
[3] Thali, M., et al. (2003). Forensic Science International 137(2): 203-208.
Introduction
Correct knee alignment and soft tissue tensions can relieve pain, improve function and increase prosthesis durability after knee arthroplasty [1]. Knee alignment and soft tissue tensions relate to the joint gap stiffness. Joint gap stiffness is typically assessed at 0° and 90° knee flexion. Guidelines for the tension of the ligaments and the distance between the femur and the tibia have not yet been defined for knee flexion between these angles [2]. The aim of this study is to provide a proof of concept for a dynamic knee tensioning device capable of measuring the joint gap stiffness at all angles between 0° and 90° knee flexion during unicompartmental knee arthroplasty.
Methods
In this study, a prototype was developed which quantify the joint gap stiffness in terms of the tibiofemoral force and the gap distance. The prototype was tested in three cadavers by applying a fixed distraction force while continuously measuring the gap distance between the femur and tibia. The joint gap stiffness was measured in the native knee (intact femur) as well as with two commercial unicompartmental prostheses fitted on the femur. Both static and dynamic measurements were recorded.
Results
Static measurements provided the joint gap distance at specified forces at intermediate angles of knee flexion. Dynamic measurements provided the joint gap distance at a constant tibiofemoral force between 0° and 90° knee flexion. Results showed a difference between the intact femur and the resurfaced femur in terms of joint gap distance (Fig.1).
Fig.1: Gap distances in the medial compartment with a tibiofemoral force of 100 N.
Discussion
The results have proven that the knee tensioner can provide insight into certain characteristics of the knee, which include knee stiffness, spatial geometry, and articulating surface geometry. The knee tensioner assesses the outcome of soft tissue balancing on a quantitative level which can be correlated to postoperative results. This may lead to the standardization of soft tissue balancing. The knee tensioner provides a concept for the design of a dynamic knee tensioner to be used during clinical unicompartmental knee arthroplasty as well as in clinical total knee arthroplasty.
Acknowledgements
This study was funded by the Smith and Nephew Clinical Study Proposal - S&N GQP 17.01
References
INTRODUCTION
Valgus knee bracing is a common treatment for medial knee osteoarthritis, and may improve functional and clinical outcomes [1]. However, effects of valgus bracing on knee contact forces, which influence structural osteoarthritis progression, have been examined only in instrumented prosthetic implant patients [2] (i.e., those with severe knee osteoarthritis) or during static standing trials [3]. The purpose of this study was to explore the immediate effects of valgus knee bracing on tibiofemoral contact forces produced during walking gait in healthy adults using an electromyogram (EMG)-driven neuromusculoskeletal model.
METHODS
A within-participant study design was used to evaluate the effects of Unloader One® valgus knee brace on tibiofemoral contact forces in 16 (9 males) healthy adults (27.7±4.4 yrs). Participants completed 20 over-ground walking trials, both with and without the brace, at their self-selected speed. Assessment order was randomised and counter balanced to limit order effects. Prior to testing, the brace was fitted to each participant’s dominant leg consistent with manufacturer’s guidelines. Participants were provided 10 minutes for familiarisation. During walking, three-dimensional lower-body motion, ground reaction forces, and surface EMGs from ten lower-limb muscles were acquired, and then used to calibrate and execute an EMG-driven neuromusculoskeletal model [1]. The model estimated medial, lateral, and total tibiofemoral contact forces (N), as well as relative muscle and external load contributions (%) to these contact forces. These variables were compared between brace and no-brace conditions using dependent t-tests. Significance was set to p<0.05.
RESULTS
Peak medial, lateral, and total tibiofemoral contact forces did not differ between brace and no brace conditions (Figure 1). Wearing the brace resulted in a 4.1% greater relative contribution of muscle to medial compartment contact loading (64.5±19.2%) compared to no brace condition (60.4±22.8%) (p<0.05). Relative contributions of muscle and external loads to lateral compartment loading were similar between brace and no brace conditions.
Figure 1. Medial (left), lateral (centre), and total tibiofemoral (right) contact forces normalised to body weight (BW) for brace (solid line) and no brace (dashed line) ± standard deviation (shading) conditions across the gait cycle (%).
DISCUSSION
Wearing a valgus knee brace did not immediately reduce peak tibiofemoral contact forces in healthy adults. This population may tune their muscle activation/neural control to counter brace-generated valgus torque, thereby maintaining normal walking patterns and contact forces. Whether pathologic populations, for whom this brace is designed, manifest similar immediate responses to valgus knee bracing remains to be investigated.
REFERENCES
Introduction: Knee osteoarthritis is a progressive disease resulting in pain and dysfunction. The medial compartment is most commonly affected, and non-surgical treatments, such as valgus knee bracing, may be effective in slowing disease progression. Valgus knee bracing may alter muscle activation patterns, which could influence muscle health, medial compartment contact loading, and structural integrity. The purpose of this study was to explore the immediate effects of valgus knee bracing on lower-limb kinematics, muscle activation patterns, and medial-to-lateral muscle co-activation in a group of healthy adults.
Methods: Sixteen healthy adults (age=27.7±4.4 yrs; BMI=23.4±3.0 kg.m-2; 56% male) participated. The brace (Unloader One®, Össur, USA) was fitted to each participant’s dominant leg according to manufacturer guidelines. Participants completed 20 walking trials, both with and without the brace, at a self-selected speed. Assessment order was randomised between participants. Participants walked wearing the brace for 10-minutes prior to testing to ensure adequate familiarization. Surface electrodes recorded electromyographic (EMG) activity from 10 lower-limb muscles, which were subsequently amplitude normalized to maximum voluntary isometric contractions. Lower-limb kinematics were calculated from motion capture data in OpenSim1. Spatiotemporal and lower-limb kinematic variables, peak medial-to-lateral muscle co-activation ratios2, and within-participant variability for each muscle were compared between conditions using dependent t-tests (p<0.05).
Results: Walking speed, stride length, and stride width did not differ between-conditions. Participants walked with significantly higher peak hip flexion (mean difference=1.3 [95%CI 0.08, 2.56]°), and significantly lower peak hip extension (mean difference=-1.8 [95%CI -0.72,-2.84]°) and knee flexion (mean difference=-2.1 [95%CI -3.00, -1.15]°) while wearing the brace. Individual muscle EMG patterns did not differ systematically between conditions. There was a trend towards higher medial-to-lateral muscle co-activation during late stance and early swing while wearing the brace (Figure 1), albeit not statistically significant.
Discussion: The immediate effects of valgus knee bracing on lower-limb kinematics and muscle activation patterns during walking in healthy adults were minimal. Co-activation ratios suggest only small neuromuscular alterations are required to counteract brace-generated valgus torque. Estimates of tibiofemoral contact forces are required to confirm any contribution to articular loading. Future investigations should aim to assess immediate- and long-term effects of valgus knee bracing on symptoms and structural joint health in individuals with knee osteoarthritis.
References
1. Delp SL et al. IEEE Trans Biomed Eng 54(11), 1940-1950, 2007.
2. Heiden TL et al. Clin Biomech 24(10), 833-41, 2009.
Figure 1. Ensemble average ± standard deviation directed co-activation (left) and total activation (right) patterns for brace (blue) and no brace (black) conditions over a gait cycle. Directed co-activation ratio=0 indicates full co-activation between the medial (vastus medialis, semimembranosus, medial gastrocnemius) and lateral (vastus lateralis, bicep femoris, lateral gastrocnemius) muscles.
The ligamentum teres (LT) is an important static restraint between the acetabulum and femoral head. It provides peak restraint when the hip is in its least stable position: combined adduction, flexion, and external rotation1. Complete and partial tear debridement has shown excellent results. However, there is a subset of patients with persistent pain and instability2 for which LT reconstruction is indicated3. Given the thinness of the cotyloid fossa, extreme caution is required to avoid damaging arthroscopically unobservable pelvic structures, such as the obturator neurovascular bundle, when drilling the acetabular tunnel. Therefore, the purpose of this study was to provide a quantitative guide to tunnel placement concurrently through the femur and acetabulum during LT reconstruction, minimizing risk of injury to the obturator bundle while remaining within the cotyloid fossa.
Nine human cadaveric pelvises, complete with femurs, (mean age: 59.6 years) were studied. Prior to dissection, a 3-dimensional coordinate measuring machine was used to record the neutral orientation of the femur in the acetabulum. The specimens were then completely dissected, digitized, and numerically re-aligned to neutral. The femur was re-positioned laterally and distally to simulate distraction during hip arthroscopy. An axis was defined on the femur to simulate a reconstruction tunnel passing through the center of the femoral neck and exiting the LT attachment on the fovea capitis. This femoral tunnel axis was extended into the acetabulum to simulate the acetabular tunnel (Fig1A). The diameter of the acetabular tunnel was set to 2.9mm4, and the tunnel was assumed to perforate the medial acetabular wall in all specimens. Finally, the femur was digitally rotated internally from -40 to 30° and abducted from -20 to 30° in increments of one degree, resulting in 3500 tested orientations. For each orientation, the location of the tunnel in the acetabulum was measured with respect to the obturator bundle and the closest border of the acetabular fossa. This data provided nine specimen-specific binary interference maps showing either clearance or collision for each femoral orientation tested. The 9 specimen-specific interference maps were combined on one large map showing the collision percentage for each femoral orientation.
By angling the femur with 15° of internal rotation and 15° of abduction, the obturator neurovascular bundle was avoided in 100% of specimens (Fig1B).
Based on the average distraction and lateralization performed during hip arthroscopy, this study determined that the femur should be internally rotated and abducted 15° when drilling the acetabular LT reconstruction tunnel. This corresponds to the posteroinferior region of the cotyloid fossa, near the native posterior LT attachment.
[1] Bardakos, JBJS 2009;91:8-15
[2] De, Arthroscopy 2014;30:1634-1641
[3] Menge, Arthrosc Tech 2016;5:e737-e742
[4] Philippon, JBJS 2012;94:1494-1498
Introduction
Athletic track is designed by straight lanes and circular curve lanes. Many tracks have the switching points between the curve lane and the straight lane because of the constant curvature for the bend as single circular. When the running distance is longer than 100-m with curve, athlete has to make transition of the movements according to the change direction because curve running has the difference characters about kinematics and kinetics. While the smoother curve of the running trajectory is assumed to cause the gradually reducing the centripetal acceleration applied, distance allowed for lateral moving is limited less than 1.22 m every lane. Therefore, athlete has to control the trajectory to stay in the lane. Especially on 200-m race, sprinters have to control their trajectory around the switching point because sprinter reaches the higher velocity than the other events. The difference of the trajectory is hypothesized to cause the difference in velocity which effect the centripetal acceleration. The purpose of this study was to investigate whether trajectory is influenced by velocity, step length and step frequency around the switch point on the 200-m race.
Method
The study was conducted on a sample of six male sprinters whose finish times were 21.61±0.11 s on 200-m race. Spatial temporal parameters (i.e. footprint trajectory, step length, step frequency, stance time, flight time and velocity) were calculated from the 10-m behind (-10 m) to the 10-m in front (+10 m) of the switching point by using images from two high-speed cameras which were located on the second floor of the spectator's area of the stadium. The evaluation value of the trajectory (ΔTrajectory) was defined the amount of the distance from the inner line on the foot contact. The Pearson correlation was used to investigate the relative influence between the ΔTrajectory and other parameters at -10 m, +10 m and the change amount during this interval.
Results and discussion
There was not the relationship between velocity and ΔTrajectory. ΔTrajectory was significantly related to step frequency (positive), step length (negative) at -10 m and +10 m. Flight time which constitutes the step frequency had also the negative correlation to ΔTrajectory, while stance time did not it. It is suggested that the ability to apply the acceleration in short stance time contributes to reducing the swelling trajectory according to the locomotion transition. From – 10 m to + 10 m, large ΔTrajectory does not lead only the smoothing transition but also loss of running distance. However, velocity and finish time were not correlated to ΔTrajectory. Therefore, it is inferred that the trajectory is configured to adapt to gait characters.Diffusing oil-based compounds (e.g. VitaminE to reduce oxidation/Lipiodol to enhance radiopacity) into UHMWPE is a time-consuming process, hence costly for manufacturing.
A model by Oral et al [1] was developed to predict the diffusion of vitamin E and other small molecular weight molecules into UHMWPE or semi-crystalline polymers. The aim of this study was to assess the use of this model to predict the diffusion of Lipiodol into UHMWPE.
Method and Materials.
Samples of un-irradiated medical grade UHMWPE (10×15×4mm3,GUR 1050, Celanese, Germany) were immersed in Lipiodol Ultra Fluid (Guerber, Cedex, France) at elevated temperatures ( 85 \degree, 105 \degree and 125 \degree C) for 18 h or 24 h. Before and after immersion, the dimensions and weight of each sample were measured (X205TDR, Mettler-Toledo, Beaumont Leys, UK).
FT-IR spectra were obtained (average of 32 scans, from 4000 to 600 cm-1, Thermo Scientific Nicolet 56, Massachusetts, United States). The concentration of Lipiodol was calculated from the area under the peak at its functional group wavelength (1726 cm-1).
Each sample was μCT scanned (XT H 225 ST, Nikon, Derby, UK). Water, air and untreated UHMWPE were used as the controls. The Hounsfield units (HU) were measured for a profile through the transverse dimension (x) of a central slice.
The analytical model was used to predict the concentration of the Lipiodol as a function of x and time (t):
Where C0 is the saturation concentration. Saturation concentration was assumed to be reached and was obtained from the concentration of Lipiodol at the surface of the samples. D is the temperature-dependent diffusion coefficient.
Results
The diffusion concentration was increased with temperature as expected. The model predicted the diffusion at the edges of centre slice reasonably but not in the central points (Figure 1).
Fig 1: Tha analytical model based on Fickian diffusion failed to predict the diffusion of Lipiodol in UHMWPE (T=105, t=24 h).
Discussion
Being able to predict diffusion of oil-based compounds would be beneficial for optimising manufacturing processes. Our findings suggest that, the previously proposed model is capable of predicting diffusion near the surface but it is unable to capture the diffusion process through the main bulk of a component. We are currently investigating alternative FE-based approaches.
References
[1] Oral et al.,(2007). Biomaterials, 28(35) p 5225.
Acknowledgements
Celanese for providing medical grade polymer and Jack Howell, Prof.Michael Whittlesey and Dr. Ali Macleod for their technical support.
Introduction
Despite different total knee arthroplasty (TKA) implants designs, none was shown to have a clear superiority over the others [1]. Symmetrical femoral component designs showed paradoxical anterior translation of the femur in flexion, leading to anterior knee pain. The laxity of the knee joint is also influenced after TKA due to variations in surgical techniques, more specific if the cruciate ligaments are retained or not. A change of pivot takes also place in the absence of the anterior cruciate ligament (2). Designs with higher congruency in the lateral compartment together with widened medial condyle have been proposed to overcome this variations. The purpose of this study is therefore to present an in-vivo analysis of the knee kinematic after lateral pivoted TKA at 2 years postoperative.
Methods
In a retrospective study, 10 subjects were implanted with a lateral pivot TKA design. The posterior-cruciate ligament was preserved in all cases. Single plane fluoroscopic analysis was conducted to assess femoro-tibial kinematics. All patients were asked to perform a weight-bearing lunge and an unloaded flexion-extension. Additionally, all patients answered the questionnaires KSS, FJS and HFKS.
Results
The analysis of the lateral and medial distal points during flexion-extension showed that the lateral condyle remained relative stationary with little rollback at maximum flexion. The medial condyle translated anteriorly during the whole flexion cycle. During the weight-bearing lunge, the lateral condyle showed a higher extent of roll back, while the medial condyle remained almost stationary (Figure1). Regarding the clinical questionnaires, good passive flexion as well as a high subject’s satisfaction with the prosthesis was observed, although inhomogeneity in the FJS was evidenced.
Discussion
Despite the specific design´s features, the results show different behavior during unloaded and loaded activities. There is a clear shift towards anterior in the medial compartment during the unloaded flexion-extension accompanied by a pivoting on the lateral compartment, which leads to the assumption that a more design driven kinematics takes place during this activity. An important aspect to be highlighted is the clear change of pivot between the measured activities. While a clear lateral pivot was observed during the unloaded activity, probably influenced by the design, a change towards a medial pivot was observed during the loaded lunge probably by the influence of the muscle activation, particularly the popliteus muscle during closed-chain activities. The clinical performance of the analyzed implant could eventually profit from specific clinical measures such as patient specific instrumentation, especially the application of gap-balancing and a controlled ligament tensioning, which has shown promising results in previous studies (3).
Acknowledgements
This work was supported by Implantcast-GmbH and EFRE (16409608-OrthoLoadLab)
References
1. Bonnin et al., KSSTA, 2011.
2. Dennis et al., J-Biomech, 2005.
3. Hommel et al., Eur-J-Orthop-Surg-Traumatol, 2017.
Introduction
Toe and forefoot fracture and laceration often occur due to an impact loading to the foot, e.g., colliding to a hard object or pinched by a moving object. Since these injuries are usually not life-threatening, only a few engineering studies have been previously conducted. In this study, to investigate the thresholds of bone fracture and skin laceration, we conducted a drop-weight impact test on porcine trotter and proposed new injury risk curves to evaluate the probabilities of bone fracture and skin laceration.
Methods
Fresh porcine trotter was selected as test specimen, because of the similarity in bone structure and geometry to the human. Fracture test and laceration test were conducted using a drop-weight impact test device (Pramudita et al, 2016). The test device was equipped with an accelerometer, a load-cell and a laser displacement meter. Fracture tests were conducted under impact velocity of 1.7 m/s to 2.6 m/s on 37 test specimens. Laceration tests were conducted under impact velocity of 0.2 m/s to 0.9 m/s on 49 test specimens. A wide-range AE (Acoustic Emission) sensor attached to the proximal part of the metacarpal bone was used for identifying the exact time of fracture occurrence according to the method proposed by authors (Pramudita et al., 2017). After the laceration test, skin tissue of the impacted area was isolated and then observed under a microscope to identify the occurrence of laceration according to the method used in our previous work (Ito et al, 2018). Logistic regression analysis was performed using JMP 12.0 to determine the relationships of the probabilities of fracture and laceration with the magnitude of mechanical parameters (load, energy, and impulse) as well as the impact velocity.
Results and Discussion
From the injury risk curves derived from the fracture test, the values of load, energy, impulse, and impact velocity at 50 % probability were 806.3 N, 1489 N⋅mm, 0.77 N⋅s, and 1.90 m/s respectively. Moreover, from the injury risk curves obtained from the laceration test, the values of load and impact velocity at 50 % probability were 198.7 N and 0.29 m/s respectively. Comparing to other studies on human (Kent et al., 2008) and porcine (Pramudita et al., 2017) under lower impact velocity conditions, the fracture load was found to be in a similar range between 800 to 1000 N under impact velocity region of 8.3E-4 to 2.6 m/s. Furthermore, the laceration load obtained from present study was higher than those obtained from quasi-static indentation test on skin sheet specimens (Ito et al, 2018). This may be due to the differences in loading rate, constraint condition, and existence of surrounding tissues.
Acknowledgements
This work was partially supported by JSPS KAKENHI Grant Number 17K06047.
In recent years, musculoskeletal computation has become a widely used tool to investigate joint and muscle forces within the human body. However, the issue of muscle fatigue is not considered adequately in most models and is a challenging task. One aspect that needs to be examined is the interaction of muscles during an exhausting task. Therefore, an experimental study was designed to analyze the changes of back muscle recruitment pattern during such exercises.
In this study 38 subjects (27 male, 11 female, height = 177±8.5 cm, weight = 74.0±13.6 kg) participated. Each subject had to perform three static and three dynamic exhausting exercises where the back muscles were loaded with subject specific forces using a dynamometer adapter especially designed for the trunk muscles. To collect the muscle activity, twelve surface electromyography sensors were applied on the back, and four on the abdominal muscles. Muscle activity and fatigue were analyzed by calculating the maximum voluntary contraction normalized signal and the median frequency. At first the fatigue of m. erector spinae and m. multifidi was analyzed, since these muscles carry the main load during the exercises. Subsequently the activity of the m. trapezius, m. rectus abdominis and m. obliquus externus were investigated to determine recruitment patterns. To gain more detailed information of these patterns a numerical model was built using the AnyBody Modeling System™. Analyzing the measurements, we can observe an increasing muscle activity during isokinetic exercises while the force is constant. Since the activity in the simulation is defined as the current force output divided by the strength of the muscle, the strength parameter was scaled down based on the measured data, assuming a linear force – activity correlation, and using a numerical algorithm considering the influence of cross talk.
The results show, that changes in recruitment pattern can be divided into three major subgroups. Prior to total exhaustion, some of the subjects show additional activation of muscles in the trapezius region, while other subjects show an additional activation of abdominal muscles, increasing the intra-abdominal pressure which supports the spine. In the third group an activation in both regions can be observed.
The numerical simulations show an increasing activity of abdominal muscles as well as muscles in the upper back. Especially the m. latissimus dorsi shows a significantly higher activity.
The results lead to the conclusion that prior to total exhaustion, additional muscles are recruited to support the main muscles. It was shown that abdominal muscles are activated to support back muscles by pressurizing the trunk cavity to delay total exhaustion as long as possible. In conclusion, the results show that changes in muscle recruitment pattern need to be considered when introducing muscle fatigue to musculoskeletal models.
Introduction
Quantitative analysis of bone microstructure has struggled in the clinical field due to a limited resolution of clinical CT scanner. A novel concept of topology optimization-based resolution enhancement for routine CT images was recently proposed inspired by the self-optimizing capability of bone. However, the proposed concept should be investigated further by conducting a larger clinical case study. As the first step toward clinical application, this study examines the clinical validity of topology optimization-based resolution enhancement and investigates age-related trabecular changes.
Methodology
For the low-resolution (LR) input images, quantitative CT images (in-plane pixel size: 702 μm; and slice thickness: 600 μm) were obtained from a total of 30 normal female patients (age span: 30 to 64 year). Three representative volume of interests (VOIs) in the proximal femur were selected: femoral head, femoral neck, and intertrochanter. The original image resolution of 702×702×720 μm3 was enhanced to that of 70.2×70.2×72.0 μm3. For the quantitative investigation, morphometric indices of the enhanced high-resolution (HR) images were compared with the corresponding anatomical data in the literature. Age-related microstructural analysis was also conducted. Finally, apparent elastic moduli were calculated as bone strength marker against sideways fall, backward fall, and falling.
Results
All morphometric indices (BV/TV, Tb.Th, Tb.Sp, Tb.N, SMI, and DA) of the enhanced images were within the range of anatomical data in the literature. As for age-related changes, BV/TV had the most significant change in the femoral neck which is a well–known fracture site. This decrease in BV/TV changed a plate-like structure to a more rod-like structure with increased anisotropy. In particular, a severe loss of horizontal bone connection was observed during aging, whereas vertical trabeculae which mainly provide weight bearing were relatively stable. This disconnection in horizontal bone causes a lower bone strength in the lateral directions.
Discussion
The trabecular patterns and morphometric indices of the enhanced HR images were comparable to the corresponding reference data in the literature. These results demonstrate the clinical feasibility of topology optimization-based resolution enhancement of clinical CT images, which can improve the accuracy and reliability of clinical diagnosis for bone diseases.
Fig 1. Age-related bone microstructure changes in the enhanced HR images.
INTRODUCTION
The main reason for failure of total shoulder devices is glenoid loosening [1]. Modular, metal-back (MB) glenoid systems consisting of a metal baseplate with screws and/or posts, coupled with a polyethylene (PE) glenoid liner, potentially offer stronger fixation to the bone. However, MB designs have historically experienced complications due to PE wear [1]. This study assessed the wear performance of a MB Vitamin-E blended highly cross-linked UHMWPE glenoid liner and compared it to that of a commercially available cemented all-PE glenoid.
METHODS
The testing method was adapted from international wear standards for best practice methodology [2] and from literature for testing parameters relevant to shoulder joint kinematics and kinetics [3].
The MB glenoid consists of a Ti6Al4V baseplate assembled to a Vivacit-E® glenoid liner by means of a snap-fit (Figure 1A). The Anatomical Shoulder™ (AS) Keeled glenoid, made from Sulene®-PE (conventional PE), was chosen as a commercially available all-PE glenoid for comparison (Figure 1A). Both designs feature an identical articular surface and were articulated against the smallest available CoCrMo humeral head to create worst-case contact pressure conditions [4]. Four samples were tested per test group including one load-soak control.
The samples were tested on an AMTI Knee Wear Simulator in diluted bovine serum (30g/l protein content). A compressive load of 756N was applied as simulator input [3]. Wear was induced by combined rolling and sliding, adding cross-shearing motions and forcing the contact zone to pass over critical regions of the liner (thinnest regions, liner edges). The test was run at 1.0Hz for a total of 3 million cycles (Mc). Every 0.5Mc, the lubricant was replaced, test samples were disassembled from the fixtures, cleaned, dried and assessed gravimetrically [2]. PE mass loss was corrected for fluid absorption using load-soak controls. Gravimetric wear rates were calculated using least-squares linear regression from 0.5 to 3Mc and converted to volumetric wear rates using the respective PE material densities.
RESULTS
The liners did not show any cracks, fractures or signs of delamination (Figure 1B). The mean volumetric wear rate of the MB Vivacit-E liners was 3.75±0.90mm3/Mc and was statistically lower (p=0.04) than that of the AS Keeled glenoids (6.95±0.66mm3/Mc, Figure 1C).
DISCUSSION
MB glenoids have been developed with the intention to reduce the rates of loosening found in all-PE glenoids, however such designs have experienced failures due to wear of the PE liner [1]. This in-vitro study shows that appropriate design and PE material selection can reduce wear in a MB glenoid compared to that of an all-PE cemented glenoid.
Introduction
From a biomechanical standpoint, bone quality, bone mineral density (BMD), implant design and postoperative loading scenarios are among the key factors determining success or failure of dental implants. These factors affect development of osseointegration and bone remodelling induced by the implant. Many theories describing bone-adaptation processes have been developed in the past [1] but effects of the above-mentioned factors on the outcome have not yet been fully understood. The aim of this study is to examine effect of initial BMD on final density distribution and on trabecular micro-architecture in mandible with inserted dental implant due to remodelling.
Methods
The remodelling was simulated using the algorithm proposed by Mullender et al. and later modified by Lian et al. [2]. 2D finite element model of human mandible including a trabecular architecture was created based on a μCT image. The model was completed by inserting a screw-type implant. The model was fixed on its lower part and a uniformly-distributed pressure (500 kPa) was applied to the outer surface of the cortical bone to account for a mandibular flexure. Two stages of implant loading were assumed: 1. Bone resistance to the implant (healing period); 2. Bone resistance to the implant + Occlusal force 40 N (subsequent full loading). Six initial BMD's were assumed (0.6, 0.8; 1.0; 1.2; 1.4; 1.6 g.cm-3). In addition, an effect of initial bone architecture was tested by assuming two types of cancellous bone representations: 1. Initial realistic trabecular architecture; 2. Initial idealized non-trabecular continuous bone.
Results
After 1000 iterations, bone was remodelled in all examined variants similarly; however, final bone mass, average BMD as well as implant motion differed depending on the initial BMD. Significant change of BMD occurred in peri-implant region and dominant bony-supports of implant apex were formed. Trabecular pattern surrounding the implant developed with a specific orientation consistent with experimental observations. Also, the crestal bone loss occurred with a good agreement with clinical observations.
Discussion
It seems that the changes of monitored parameters are not necessarily proportional to the change of the initial BMD. The straightforward proportionality can be observed only in the idealized non-trabecular model. However, the results suggest that the outcome of the bone remodelling depends strongly also on the initial and/or actual trabecular architecture.
Fig. 1: Typical outcome of bone remodelling prediction (initial BMD = 1.0 g.cm-3, trabecular variant). Situation at the beginning (left), at the end of Stage 1 (middle), and at the end of iterative process (right).
Acknowledgements
The research was supported by the Czech Science Foundation: Grant No. 16-08944S.
References
[1] Lin, D., et al., (2009). J. Mech. Behav. Biomed. Mater. p.410-432.
[2] Lian, Z.Q., et al., (2010) IOP Conf. Ser.: Mater. Sci. Eng. 10 012125
Introduction
Ophthalmologists often maintain static postures of the neck, shoulder, elbow, and wrist during their routine clinical examinations, which may lead to work-related musculoskeletal diseases (MSDs)[1] and a decreased capacity for healthcare delivery. Ophthalmologists' posture, ergonomics, and occupational discomfort are currently evaluated qualitatively using survey methods, such as visual analog scale (VAS) pain level reporting[2] or quantitatively using electromyography[3]. A combination of marker-based motion capture and electromyography may provide an objective, quantitative methodology to examine posture and suggest postural adjustments that will reduce the risk of developing MSDs.
Methods
10 pediatric ophthalmologists performed simulated retina exams on a child CPR manikin using a slit lamp biomicroscope and a 90D lens. Postural kinematics and muscle activity were measured using marker-based motion capture and surface electromyography, respectively. Examinations were performed under 3 conditions: no postural adjustments, postural adjustment by altering slit lamp platform height and patient position, and postural adjustment with elbow rest under arm holding the 90D lens. Sagittal plane neck flexion angle and neck and shoulder muscle activity were compared among these 3 conditions for all ophthalmologists. Paired t-tests were used to compare these variables (presented as mean ± 1 SEM).
Results
Sagittal plane neck flexion angle range of motion decreased significantly after postural adjustment (41.4±3.3° vs. 36.4±2.8°, p = 0.023) and elbow rest placement (41.4±3.3° vs. 35.8±2.8°, p = 0.025). Upper Trapezius muscle activity (procedural activation area) decreased after postural adjustment (106.1±52.9mV vs. 88.3±46.0mV, p = 0.137) and elbow rest placement (106.1±52.9mV vs. 87.6±45.0mV, p =0.186). Percentage of procedural time that the anterior deltoid was active decreased slightly after postural adjustment (38.8±3.7% vs. 37.43±4.3%, p = 0.756) and decreased significantly after elbow rest placement (38.8±3.7% vs. 31.37±3.9%, p = 0.037).
Discussion
The observed reduction in neck flexion and upper trapezius activity after postural adjustments may indicate lower exposure to sustained non-neutral neck postures that can cause MSDs. The decrease in anterior deltoid activation after installing an elbow rest may indicate a practice that could lead to reduced stress related to prolonged, unsupported arm raise. Quick postural adjustments may decrease the possibility of occupational MSDs by reducing time spent by ophthalmologists in un-ergonomic postures.
Acknowledgements
The authors would like to thank Children’s Mercy Kansas City for the use of their pediatric ophthalmology clinic for testing, and the UMKC Center for Health Insights for their Optitrack Flex 13 motion capture system.
References
[1] NIOSH, NIOSH Publication 97-141, 2, 1997.
[2] Kitzmann et. al., J Ophthalmol, 119(2): 213–20, 2012.
[3] Fethke et.al., Int J Ind Ergon, 49: 53-59, 2015.
Introduction
Parkinson’s disease (PD) is characterized by tremor, rigidity, bradykinesia and postural disturbances. The motor symptoms usually occur first on one side of the body in about 80% of patients [1]. It is also typically an asymmetrical disease. Subthalamic deep brain stimulation (DBS) has been shown to improve the motor function of PD [2]. However, studies on the influence of subthalamic DBS on the biomechanics of the lower extremities during gait remain limited. The current study aimed to establish preliminary understanding of the gait performance in patients with advanced PD before and after bilateral subthalamic DBS.
Methods
Five adults with advanced PD and five healthy controls participated in the study. All PD participants had undergone medication and received bilateral subthalamic DBS surgery. Each subject wearing thirty-nine infrared retro-reflected markers walked at a self-selected pace while the kinematic and kinetic data were measured using an 8-camera motion capture system and two force plates, respectively. All PD subjects were tested under two conditions: (1) medication on before DBS surgery (pre-DBS) and (2) medication on and 3-4 months after DBS surgery (post-DBS). Spatiotemporal variables, peak values of the joint angles and moments were obtained. The between-group differences of the peak values of the joint angles and moments were also calculated. Gait symmetry was evaluated by comparing between-side differences in the peak values of the joint angles in the sagittal plane. A between-side difference of 0 indicates perfect symmetry.
Results
Post-DBS showed increased stride length, step length, cadence, and speed but reduced step width for both minor and major affected sides when compared to those pre DBS. Pre-DBS showed decreased deviations in the peak angles at the hip, knee and ankle in sagittal plane and frontal plane for both limbs during stance and swing phases. Pre-DBS showed reduced to below 2.9%BW*LL in the peak moments at all three joints for both limbs when compared to pre-DBS. For gait symmetry, between-side differences in the peak angles were within 1.1° for controls while the PD subjects showed between-side differences from 2.7-7.8° for pre-DBS and 1.2-2.7° for post-DBS (Fig 1).
Discussion
In post-DBS, bilaterally increased spatiotemporal variables, reduced base of support, and reduced kinematic and kinetic deviations, as well as improved gait symmetry all suggest that bilateral DBS treatment was effective in improving the gait performance. The current results encourage further study to include more subjects to confirm the efficacy of DBS treatment in PD gait.
References
Introduction
Inertial measurements units (IMU) are a promising alternative to traditional stereophotogrammetry motion capture systems to acquire human motion. However, their use in combination with musculoskeletal models has been limited. OpenSim is a popular musculoskeletal modelling software [1] that has been used with traditional stereophotogrammetry systems to provide real-time biofeedback of musculoskeletal tissue loading for gait retraining and rehabilitation [2]. Driving OpenSim models with IMUs in real-time will enable these same applications to be performed outside the laboratory.
This study aimed to (1) interface OpenSim with IMUs, (2) compare joint angles estimated via marker-based and orientation-based inverse kinematics (IK), and (3) assess real-time performance of the orientation-based IK.
Methods
Marker trajectories and IMU orientations were synchronously collected at 200Hz using a 12-camera motion capture system (Vicon, Oxford, UK) and Noraxon myoMOTION (Noraxon, Scottsdale, AZ, USA), respectively. Seven IMUs were placed on the lower limbs of three participants, one per segment. Retroreflective markers were rigidly attached on IMUs via custom-made 3D printed housings, and also placed on anatomical bony landmarks. Marker trajectories from a static trial were used to scale a generic OpenSim model to each participant and register the IMUs to the scaled model. Participants performed overground walking at self-selected speed. Joint angles from a total of 52 gait cycles calculated via marker-based IK [1] and orientation-based IK [3] were compared using root mean square errors (RMSE) and coefficient of determination (R2). The same data were also used in a real-time framework [4] to evaluate performance of the orientation-based IK.
Results
Orientation-based and marker-based IK produced similar results (Figure 1). No differences were present in joint angles calculated using offline and real-time orientation-based IK. Real-time orientation-based IK solved each frame in 1.49 ± 0.30 ms, corresponding to 670 frames/second on average.
Figure 1 – Joint angles calculated from marker-based IK (solid blue) and orientation-based IK (dashed red) for 52 gait cycles from three individuals. FE = flexion-extension, AA = adduction-abduction, IR = internal rotation, PDF = plantar-dorsiflexion, IE = inversion-eversion, shaded area equals 1 standard deviation.
Discussion
We have enabled real-time estimation of joint angles in OpenSim using IMUs and an orientation-based IK algorithm, which shows promising results. Using IMUs removes the need to manually label, clean, and gap-fill marker data, reducing labour and possible error sources . Further validation will be required to assess performance of the orientation-based IK for different motor tasks.
References
1. Delp, S.L., et al., (2007) IEEE Trans Biomed Eng, 54(11) p1940-50.
2. Pizzolato, C., et al., (2017) IEEE Trans Neural Syst Rehabil Eng, 25(9) p1612-1621.
3. Tagliapietra, L., et al., (2017) Comput Methods Biomech Biomed Engin, Under review.
4. Pizzolato, C., et al., (2017) Comput Methods Biomech Biomed Engin, 20(4) p436-445.
Introduction
The main toughening mechanism in cortical bone is due to propagating cracks interacting with microstructure. Typically, cracks deflect at cement lines, which are weak interfaces surrounding osteons. With age, the fracture resistance of cortical bone is decreased and fracture paths get shorter and less irregular [1]. However, little is known about how this relates to changes in the mechanical properties. The objective of this study was to develop a computational model to study crack propagation in different directions in cortical bone in order to understand the influence of microstructure and material properties on the crack path and fracture resistance.
Methods
The XFEM framework in Abaqus was adopted to explicitly represent the crack path. A damage model based on the quadratic nominal strain criterion was developed for the cement line to capture crack deflections at the osteonal boundary. The maximum principal strain criterion was used for crack propagation through matrix, osteons and cement lines with the critical strain εc=0.004. The model was tested on simplified 2D-models of cortical bone including longitudinal, transversal or radial osteons loaded in tension (Fig. 1A,C). Linear elastic materials were used with E(matrix)=15GPa, E(osteon)=12GPa and E(cement line)=18GPa. The strain energy release rate was assumed to be 0.1N/mm for all materials and crack paths from weak and strong interfaces were evaluated.
Results
The interface strength had a large influence on the crack path, where weak interfaces caused crack deflections along the cement lines (Fig 1). Crack deflection occurred if the critical interface strain was 20 or 4 times lower than εc for longitudinal and radial models, respectively. In the transverse models, the crack deflected for all critical interface strains lower than εc. The crack path in contact with the osteon was 3.4 times longer in the longitudinal models and 1.5 times longer in the radial models when deflecting around the osteon compared to propagating through it. Crack deflection increased the work to fracture with approximately 20% for both test geometries.
Figure 1: Predicted crack paths from tensile tests of (A) longitudinal and (C) radial models with strong and weak cement line interfaces. (B, D) Corresponding force-displacement curves.
Discussion
This model captures the characteristic crack paths seen experimentally in cortical bone and predicts increased fracture toughness from crack deflection. Unlike previous XFEM-models that were restricted to the radial direction [2], this model can be applied to all osteon directions. It can be used to investigate the influence of local damage parameters, which are difficult to measure experimentally.
Acknowledgements
Funding from Swedish Foundation for Strategic Research [IB2013-0021].
References
[1] Koester, K.J., et al., (2011) JMBBM, 4(7) p1504
[2] Li, S., et al., (2013). Int J Fract, 184(1-2) p43
INTRODUCTION
Moving from ‘hard’ to ‘soft’ exoskeletons in rehabilitation the traditional robotics paradigms for sensing and actuation in the exoskeleton joints do not hold anymore due to the extreme loss of stiffness in limbs and joints of the exoskeleton components.
In fact assessment of kinematics and kinetics in soft exoskeletons resembles more a traditional human 3D analysis of movement paradigm using independent IMUs. As a consequence, one has to deal with e.g. soft tissue artifacts and with observability issues of the IMUs natural references gravity and earth magnetic field, both disturbing accurate kinematics estimation. [1].
Simultaneously many extra demands have to be met following from the physical layout of the exoskeleton, the presence of additional sensors and actuators, the control strategy for the soft exoskeleton system and the user roles.
Solutions are limited by physical limitations and capabilities of the system hardware and communication channels.
So this requires an extremely flexible data monitoring and feedback solution.
Figure 1: Schematic XoSoft connected motion monitoring and feedback platform.
METHODS
As part of the XoSoft soft exoskeleton project a monitor and feedback system for all kinematics, kinetics and exoskeleton control data is developed that fulfills all these demands in a way that offers maximum flexibility to deal with changes in the demands and possibilities inherent to the iterative design process, by offering easy moving around of functional software modules from one hardware component to another.
This is facilitated by defining a self-organizing distributed data pipeline and data channel type administration with TCP/IP communication between all modules as well as using the same OS (Windows10) and software development system (LabView 2015) on as many of the off- or online hardware components as possible. This facilitates module development and tested on one central system and subsequent easy deployment on different devices at different locations. Data is stored in a central database facility. Functional modules are developed for:
-communication with several hardware platforms (Xsens MTw2 IMU sensors, XoSoft control system, additional exoskeleton sensing and feedback hardware, patient interaction).
-for body segment and joint kinematics [2], kinetics estimation and data segmentation
-for parameters estimation and summaries plus event detection for feedback to several types of users.
To facilitate context-based interpretation of recorded data by the users and also provide patient behavior context to the control system modules for adaptive activity recognition of activities [3] and detection of intention are developed.
DISCUSSION
So far it appears that the flexibility of the module localization is serving the changing and flexible nature of the XoSoft concept, while the chosen OS appears on more and more hardware platforms.
ACKNOWLEDGEMENTS
Horizon 2020 program project XoSoft (688175)
REFERENCES
Vries de et al. 2009
Baten et al.2000
Wassink et al. J. 2007.
References
1. Franssen EH., et al., (1999), J Am Geriatr Soc, 47(4), pp.463-469
Introduction: Micro-Finite Element Models (μ-FEMs) derived from micro-computed tomography (μ-CT) are an important tool for microscale structural analysis of trabecular bone. Hexahedral meshes are desirable for μ-FEMs since they are numerically more efficient than their tetrahedral counterparts. However, the tools that are presently used to generate hexahedral μ-FEMs are either computationally expensive or limited to relatively simple geometries. This a consequence of the large size of μ-CT data as well as the high precision required to avoid numerical errors in floating-point operations.
Objective: To develop an algorithm capable to efficiently generate hexahedral μ-FEMs.
Methods: The core of the μ-CT voxel representation resides in its centroid location that is paired with its density/gray-intensity value. The developed algorithm relies on fast and robust integer operations for the discretization the entire geometric domain into elementary 4D voxels of a desired size. The use of a grid on which μ-CT voxels are projected allows facile changes in the resolution of the mesh through simple merge/divide voxel operations. Furthermore, the integration of the octree structures permits the generation of the coarser meshes while preserving the overall volume of the mesh. In this approach, the FE elements are typically restricted to eight-node brick elements because they can be efficiently built using grid parameters. The material of each brick element is assigned according to the appropriate voxel gray-intensity value. However, all nodes and materials have to be pooled in separate containers and the determination of the appropriate indices for each tends to be time-consuming for sizeable μ-CT data. To accelerate this, hashing techniques were used to pair each node/material with a locational key. This technique enables the interrogation of the data over a much shorter time than the one associated with the traditional array indexing methods (i.e., up to four orders of magnitude for tested models).
Results: The algorithm has been implemented in C++ and tested against several μ-CT samples of the trabecular bone. The hardware used for testing included a common Core-i7 6700K CPU equipped with 16 GB RAM. The algorithm generated 36M voxels in only 55.16 s such that it was not surprising to observe that the discretization/meshing of a clinical CT scan of the scapula has needed only 0.55s runtime. Additional tests revealed that a predictable linearity between the size of the model and meshing time.
Significance: The developed algorithm represents one of the first attempts towards an efficient and fast generation of the hexahedral μ-FEMs. Since mesh generation represents one of the stepping stones in structural analysis, it is expected that this technique will enable future downstream research to incorporate more accurate/realistic bone models.
Introduction: Anterior knee pain (AKP) cohorts have exhibited significant differences in segment coordination (Coord) [1] and coordination variability (CoordVar) [2] compared to their asymptomatic counterparts. Both Coord and CoordVar have been related to both the presence of pain and the onset of injury [3]. Knee bracing provides a low-cost resource to assist knee pain moderation during locomotion. It was hypothesised that standard and custom-fit hinge knee braces would influence Coord and CoordVar during both walking and running in females with AKP.
Methods: Eighteen females (nine AKP, nine asymptomatic) performed ten walking (1.3 m.s-1) and 10 running (3.2 m.s-1) trials in three conditions: no brace, standard hinge brace and custom-fit hinge brace. Trials were completed in a blocked randomised order. Three-dimensional unilateral lower-limb kinematic data were obtained and segment angles were calculated. Thigh-shank flexion/extension (TSfl/ex), abduction/adduction (TSab/ad) and internal/external rotation (TSir/er) Coord and CoordVar were calculated using a modified vector coding technique [4]. To compare across group (AKP and asymptomatic) and condition (no brace, standard brace and custom-fit brace), circular two-way ANOVAs (P<0.05) were performed using Statistical Parametric Mapping.
Results: AKP utilised significantly different TSfl/ex, TSab/ad and TSir/exr coordination patterns during walking compared to the asymptomatic cohort (Fig 1). No significant inter-group coordination differences were identified across the stance phase for running. TSab/ad and TSir/exr CoordVar differed significantly between AKP for walking and running. Lower variability was identified for AKP, with the exception of TSir/exr during walking, where CoordVar was greater (36.0) than the asymptomatic group (22.1) during 28%-29% of stance (F=10.79; P=0.01). The only significant difference between brace conditions was TSfl/ex coupling during walking at 0%-2% of stance. When wearing the customised brace, participants transitioned from in-phase to anti-phase over the respective time phase (89.3°-93.3°).
Discussion: Thigh-shank Coord differences between AKP and asymptomatic cohorts were found only during walking. The decreased CoordVar in the sagittal and frontal planes observed in AKP supports previous findings [2, 3]. Greater AKP TSir/exr variability around the time of peak flexion and maximum knee loading (28%-29%) may be attributed to a search for a less painful movement pattern. The overall influence of hinged knee braces on thigh-shank segment coupling and variability in locomotion was found to be minimal, suggesting current knee braces do not utilise optimal bracing mechanisms to support healthy variability motion couplings in AKP.
Acknowledgements: Funding was provided by Bayer U.S. LLC.
References
INTRODUCTION
Dravet Syndrome (DS) is a rare childhood disease characterised by polymorphic seizures, intellectual disability, ataxia, myoclonus, and pyramidal/extrapyramidal signs. Gait abnormalities have been described via observational video analysis [1]. Baropodometry might help quantifying these abnormalities even on scarcely collaborative subjects [2]. This study aims at characterising pressure footprints of subjects with DS.
METHODS
Nine patients (DS; 14.7±6.0 years; BMI: 19.5±3.6 kg/m2; foot‑size: 23.4±2.4 cm) and seven control subjects (CS; 15.1±10.5 years; BMI: 16.9±5.6 kg/m2; foot‑size: 22.3±3.7 cm) were asked to walk self-paced and barefoot. At least five right and left footprints were recorded with a pressure matrix (Novel – DE; 100 Hz). Contact area (CA, cm2), averaged force (AF, %BW), contact time (CT, %stance and ms), maximum averaged pressure (AP, kPa), and maximum force (MF, %BW) were calculated for forefoot (M1), midfoot (M2), rear‑foot (M3), lateral-foot (M4), medial‑foot (M5), and the whole Foot. Variability over the five strides of each parameter for each participant was evaluated via the Coefficient of variation (CV) [2]. Differences between DS and CS were tested with a Mann‑Whitney test (p=0.05).
RESULTS
Maximum force (MF) appeared reduced at M3 (right foot RF: 77 %BW in DS and 99 %BW in CS, p=0.01; left foot LF: 76 %BW in DS and 98 %BW in CS, p=0.01). Contact time increased bilaterally for all the regions of interest, except in M3 of LF (e.g. Foot-LF: 743 ms in DS, 555 ms in CS, p=0.01; Foot-RF 734 ms in DS, 574 ms in CS, p=0.01). Significant increments of the CV for CT of the LF in M3, M4, and Foot emerged (p<0.04), with increased variability of AF at M1 (0.10 in DS and 0.7 in CS, p=0.01) and M3 (0.30 in DS and 0.13 in CS, p<0.01). Increased CV-AP of LF was detected (0.16 in DS and 0.9 in CS, p=0.04) for the whole Foot, as well as for left M3-4-5 (0.14, 0.13 and 0.16 in DS; 0.10, 0.09 and 0.08 in CS at M3, M4, and M5; with p=0.02, 0.04 and 0.03 respectively).
DISCUSSION
Highlighted reduced force exchanged with the ground at the rear‑foot suggest defective propulsion, which is in line with results obtained with conventional gait analysis. Defective propulsion is compensated by trunk anteposition, and an increased force applied by fore- and midfoot to the ground. A marked lateralization of balance function emerged, with dominant foot providing more stable support. These results suggest that baropodometry can be considered a valid alternative to conventional gait analysis in hardly compliant subjects with DS.
REFERENCES
[1] Rodda et al. Arch Neurol 2012;69(7):873-8.
[2] Giacomozzi, Stebbins. GaitPosture 2017;53:131-138.
Introduction
Contact pressure (CP), contact area (CA), and Peak Force (PF) are parameters showing the knee biomechanics subjected to compressive loading. Contact pressure will vary depending on the activity and the flexion angle [1]. Also, knee biomechanics changes because an Anterior Cruciate Ligament (ACL) rupture [2] [3] [4]. This study sought to compare some variables like contact pressure, contact area and peak force in healthy knees with those with ruptured ACL at three different flexion angles.
Methods
Specimens
Seven (7) knees of 4-months old pisg obtained from a slaughterhouse and were carefully dissected keeping all the ligaments and the articular capsule, the patella was removed and an incision was done to place the pressure sensor on the tibial plaeau.
The specimens were subjected to a 700 N compressive load for three different flexion angles (70o, 55o and 40°) using a MTS BIONIX 515.11 (MTS Corporation). All the knees were tested at normal conditions and then ACL was injured by hyper-extension applying a load in the posterior side of the shinbone with fully extended leg until the ligament failed. Knee Sensor TEKSCAN 4000 and the software I-Scan 7.65 (Tekscan Inc.) were used to determine the CP, CA and PF. During the test the knees were sprayed with a water-salt solution (0.5 % in weight) to maintain the joint wet.
One way ANOVA was used to determine significant statistical differences. If any difference was found, a Bonferroni post-hoc test was done to assess any differences between angles.
Results
The results of this study showed significant differences for the higher flexion angle (70°) the CP, CA and PF in both healthy and injured knees. Moreover, PF had significant differences for almost all flexion angles for the knees tested. On the other hand, for lower (40°) and medium (55°) CP and CA has not shown significant differences.
Table 1. Significant Differences on CP, CA, and PF (p<0.05) X=Found; O=Not found.
Discussion
The results found on this study suggested that an ACL injury changes the mechanical behaviour of the knee. It seems that contact properties are not crucial for lower and medium angles. However, PF is a parameter that increased with flexion angle, and then is critical for ACL ruptured. PF values are similar to those found by Miller [4].
References
Mow & Hayes, Basic Orthop Biomech, 1991
Killian et al, J of Surg Proc, 164: 234-241,2010
NIKOLIĆ, Knee Surg, Sports Traum, 6: 26-30, 1998
MILLER et al, Journal of Biomech, 42: 1355-1359, 2009
Introduction
Shock pad is becoming popular as an underlayment installed under a synthetic turf fields [1]. Since the practice with both synthetic turf and shock pad is new, research on effects of this combination on impact related variables and sport movement biomechanics is scarce in literature. Therefore, purpose of this study was to examine impact attenuation related biomechanical characteristics of a 90° cutting movement on a synthetic turf (TURF) and the synthetic turf plus a shock pad (PAD).
Methods
Twelve recreational football and soccer players participated in this study. They performed five successful trials of 90° cutting movement in each of two approaching speed conditions: 3.0±0.3 (Slow cut) and 4.0±0.4 (Fast cut) m/s on each of TURF and PAD surfaces in a laboratory setting. Kinematic and ground reaction force (GRF) data were collected simultaneously. A 2” monofilament synthetic turf with 1/2” stitch gauge was used in TURF and PAD conditions. A foam based shock pad was used in PAD condition.
Results
For surface differences, there was an increase in frontal-plane peak loading eccentric power but a decrease in peak pushoff eccentric power on the PAD surface (Table 1). A significant interaction was found for sagittal-plane peak knee eccentric power. Peak sagittal-plane eccentric power increased for the fast velocity compared to the slow condition on the PAD condition (p > 0.001).
With increasing approach velocity, there was an increase in loading peak vertical GRF but a significant decrease in pushoff peak vertical GRF. At the knee joint, there were significant increases in the peak knee extension moment, and peak knee loading and push-off adduction moments with increased velocity. The fast speed also caused significant increases in frontal-plane peak loading and push-off eccentric power.
During 90° cut, only peak knee frontal-plane loading eccentric power were increased in the PAD conditions regardless of cutting speeds. This suggests that during the loading phase, there were increased eccentric contractions of knee muscles for joint stabilization. However, peak sagittal-plane extension moment and knee eccentric loading power were not different between turf conditions, suggesting that overall loading to knee joint was not likely increased. A reason for the lack of more differences between the turf surface with and without PAD may be due to the limitations of inverse dynamics, which cannot capture increased muscle co-contraction to help stabilize the knee joint on TURF condition with less surface compliance.
Acknowledgements
This study was funded in part by a gift from Brock International.
References
Background
Humans spend around a third of a lifetime in bed[1]. Sleep disturbance is becoming increasingly recognised as a clinically important symptom in people with chronic low back pain[2]. There are a variety of mechanisms that reduce back pain and improve quality of sleep by decreasing spinal muscle activity, improved spinal alignment, and reducing pressure at main contact areas between the body and the sleep surface[3,4,5]; one of which involves mattress comfort layers.
Methods
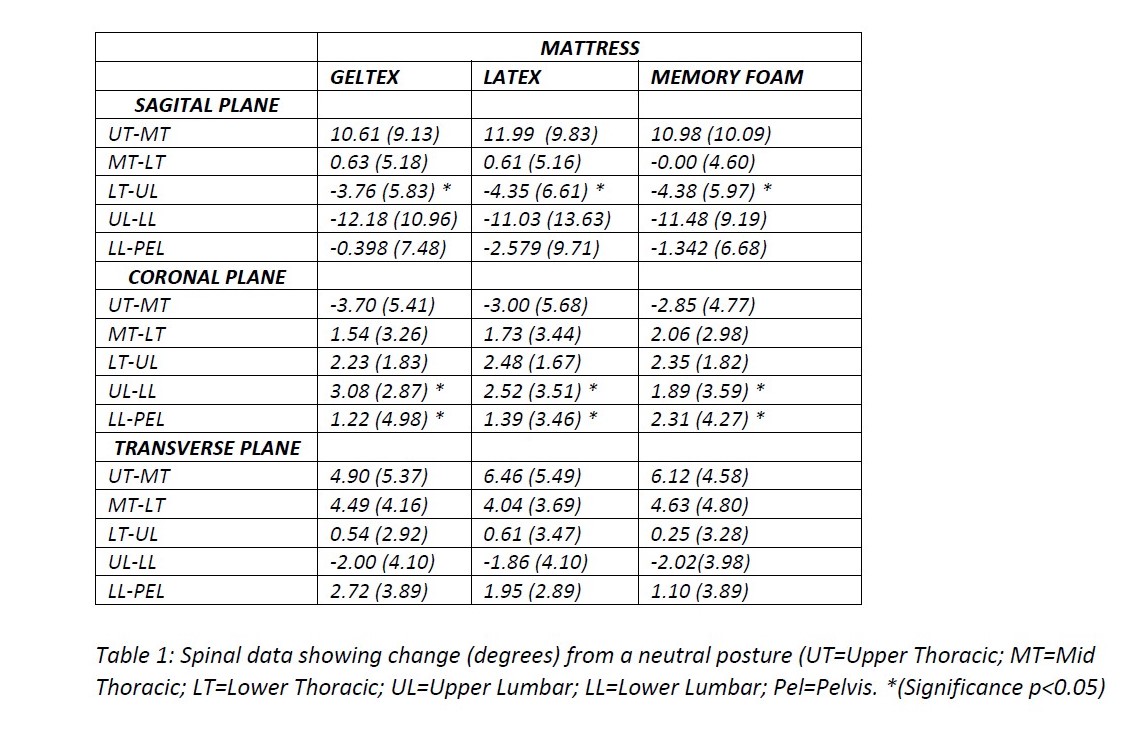
Twenty participants volunteered for this study. Ten QualisysTM cameras recorded movement of the spine in 6-degrees of freedom using a multisegment spine model[4] during side-lying on three visually identical mattresses. Internally all mattresses contained an identical zoned 1000-count spring configuration with three different comfort layers of equal depth (Geltex, Latex and Memory Foam). Peak pressure distribution was measured at the hip and shoulder and additional comfort and firmness ratings were recorded.
Results
A statistically significance difference was seen in the peak pressure of the shoulder between mattresses. A Pairwise comparison showed that the Geltex was significantly different than Latex (2.36kPa) and Memory Foam (2.41kPa). Within mattress peak pressure at the shoulder also changes significantly over time for the Geltex and Latex mattresses but not Memory Foam. Lower peak pressures were shown at the hip for Geltex (2.17kPa) when compared to Latex (2.39kPa) and Memory Foam (2.51kPa). Though Geltex was perceived the most firm, hip peak pressure changes significantly over time in Latex and Memory Foam but not in Geltex.
In the coronal plane there was a statistically significant difference between the mattresses at the upper lumbar to lower lumbar segment with differences shown between: Geltex and Latex, Geltex and Memory Foam and Latex and Memory Foam. The lower lumbar to pelvis segment also showed significant difference between: Geltex and Latex against Memory foam. In the sagittal plane the lower thoracic and upper lumbar segment showed statistically significant differences between mattresses shown between Geltex and Latex and Geltex and Memory foam.
Discussion
Evidence suggests that a Geltex comfort layer will disperse pressure at the hip and shoulder more effectively than either Latex or Memory Foam comfort layers. Geltex showed significantly less deviation from the spinal neutral position in key areas around the lower lumber suggesting a more neutral spinal posture to afford improved relaxation.
Acknowledgements
Staff time for this project was funded by Silentnight Group Ltd.,UK.
References
The two-stage revision protocol represents the current gold standard for treating infected total knee replacement implants; When an infected prosthesis is first removed, patients will receive an antibiotic-loaded cement spacer. After about 6-12 weeks when the infection is eradicated, a second surgery is performed to remove the spacer and re-implant a revision prosthesis. Muscle loss and soft tissue retraction during the time between procedures are common; they also prolong the second surgical stage and the recovery thereafter. Dynamic spacers allow some knee movement, which may also facilitate re-implantation during revision surgery.
A knee spacer should be adequately dosed with antibiotics, maintain the articular distance at the tibiofemoral joint, stabilize the knee and allow for passive motion of the joint (Scott et al., 1993). However, to prevent muscle atrophy, allowing early mobility between staged procedures will enable early restoration to knee function. In this study, we want to biomechanically assess the loading capacity of implanted dynamic knee spacers.
Experiments were performed on the MTS (MN, USA) testing machine. All 8 knees were prepared with implanted prosthesis. Thereafter, the prosthesis was removed, and the dynamic cement spacers were implanted. X-ray images of all specimens were performed prior testing, to ensure the integrity of the specimens. In the first test protocol, 4 knees were loaded to failure, where a single axial load was applied at 200mm/min. In the second test protocol, 4 knees underwent cyclic loading in 5 steps of 1000 cycles each from 30-400N, 30-600N, 30-800N, 30-1000N, 30-1200N at 1.5Hz. Axial displacement after every 1000th cycle was recorded.
The knee spacer could withstand a single axial load of 4922N, with the displacement after 5000 cycles to be 2.23mm. While there were previous studies on dynamic knee spacers, few have reported the allowable loading capacity of dynamic spacers. Evans 2004 and Van Thiel et al., 2011 allowed touch-down or partial weight bearing, but no more information was provided. Wan et al., 2012 encouraged the patients to gently load bear to 312N. Kohl et al., 2011 instructed the patients to partial weight bear to 196N after the second day of surgery. Our study demonstrated that dynamic knee spacers may be able to withstand more than the ‘touch-down’ load previously allowed in other studies, and this may permit more ambulation for patients.
Acknowledgements
We would like to acknowledge funding received from the Stiftung Endoprothetik (Proj nr. S02/17).
References
Evans RP. (2004). Clin Orthop Relat Res. 427:37-46.
Kohl S, et al., (2011). The Knee. 18(6):464-9.
Scott IR, et al., (1993). J Bone Joint Surg Br. 75(1):28–31.
Van Thiel GS, et al., (2011). Clin Orthop Relat Res. 469(4):994-1001.
Wan Z, et al., (2012). J Arthroplasty. 27(8):1469-73.
Introduction
Patients with Parkinson's disease (PD) show a characteristic pattern of locomotion deficits result of the motors [1,2]. Information on gait and force changes is still unclear when unilateral onset of symptoms begins. Thus, the study aims to verify if the unilateral onset of PD symptoms affects isometric force of plantiflexors, electromyographic activation, neuromuscular efficiency (NME) and functional gait variables.
Methods
Twelve individuals with PD (age 63.7±10.8, BMI 23.9±2.6) Med-ON phase were evaluated. He analyzed isometric muscle strength (IMF) and tivity muscle with 5 second time support of the lateral gastrocnemius (GTL) through the load cell Miotec®SD50 and Trigno™ EMG System. Three maximal contractions were performed at intervals of one minute between each, for the beginning of contractions of the contralateral limb, the interval was two minutes. It used a capture system motion Vicon de twelve chambers Model T-series gear speed record with the aut selected and bare feet.
Results
The sample showed onset of symptoms in right half-body, where functional values of isometric muscular strength of the GTL, step length and pass length were higher than the subjects who presented the initial symptoms to the left (Fig.1). When related to isometric strength, EMG and NME with the step length and passed the data pointed only relation of the subjects with onset of the symptoms to the right in the isometric strength of the GTL-Left (r = -0.860, r = -0.893, r = -0.881, r = -0.756, r = -0.924, r = -0.870), GTL-Right (r = -0.936, r = -0.945, r = -0.868 ; r = -0.963; r = -0.953), GTL-Average (r = -0.912, r = -0.933, r = -0.927, r = -0.825, r = -0.958, r = -0.926), with stride length left, right and average and left step length, right and average.
Discussion
The right limb when initially affected by the PD signals presented functional values of pitch and stride lengths greater than those with the initial symptoms on the left. It is assumed that postural instability is one of the motor symptoms in PD, which in turn may explain the fact that when the left limb is affected initially it will require the subject to seek the maximum possible dynamic stability to maintain functional gait. The lower IMF condition GTL relate to higher values in gait spatial and temporal parameters shows that the functional gain with early symptoms right, the propellant should not muscles, but possibly some upward muscles.
Acknowledgements
Research Ethics Committee – UNB- nº 1748211.
References
1. Hausdorff JM. Chaos. 2009;19(2):1–14.
2. Kwon K-Y, Lee HM, Kang SH, Pyo SJ, Kim HJ, Koh S-B. Gait Posture. 2017; 58:1–6.
16:25 - 16:40
For the year ending June 2017, there were 36,998 knife crimes recorded in the UK which was an increase of 26% on the previous year. In the same time period, there were 629 homicides (excluding the London and Manchester terrorist incidents which were responsible for 35 deaths) in the UK. Of the 629 deaths, 214 (34%) were owing to use of a knife or sharp instrument. In all countries were guns are not widely available, stabbing is the most common way of committing murder. In order to better understand how the forces involved in stabbing relate to those generated by volunteers, we used a novel dynamometer to allow the forces for stabbing into skin simulant, pork leg and pork rib to be measured. The forces generated were significantly greater than those required to penetrate skin with a sharp implement. The results show that the key criteria for whether or not an implement penetrates skin is whether or not the tip is sufficiently sharp to puncture skin and clothes at the force generated by the person stabbing. The results of stabbing tests with knives, screwdrivers, bottles and with the presence of clothes is discussed.
16:40 - 16:55
16:55 - 17:10
Osteoporosis-related fractures account for two million broken bones and $19 billion in related costs each year. Many factors contributing to osteoporotic fracture risk have been identified, but the most reliable predictor of fracture risk is a previous fracture of any kind. Subjects with a previous fracture are several times more likely to sustain a future fracture than those with no history of fracture, even after controlling for bone mineral density (BMD). The etiology of this increased fracture risk is not fully known, but it is possible that an incident fracture is followed by a systemic loss of bone that could lead to an increased risk of subsequent fractures at all skeletal sites.
To investigate the time course of systemic bone loss and recovery following fracture, we investigated the response to transverse femur fracture in young (3 month-old) and middle-aged (12 month-old) female C57BL/6 mice. At multiple time points after fracture, trabecular and cortical bone microstructure were quantified using micro-computed tomography (μCT) at the L5 vertebral body, contralateral femur, and contralateral radius; whole-body BMD was quantified using dual-energy x-ray absorptiometry (DEXA); bone mechanical properties were quantified using mechanical testing and finite element analysis; voluntary movement was quantified using 24-hour Open Field analysis; and systemic inflammation was quantified with ELISA analysis of serum interleukin 6 (IL-6). We found that fractured mice exhibited a significant systemic inflammatory response (Fig. g-h) and altered voluntary movement patterns (Fig. e-f) 3 days post-fracture, but not at later time points. Femur fracture initiated an 11% and 18% loss of trabecular bone volume at the L5 vertebral body 2 weeks post-fracture in young and middle-aged mice, respectively, compared to control mice (Fig. a-b). By 6 weeks post-injury we observed complete recovery from this bone loss in young mice, but recovery of bone volume in middle-aged mice was unclear. This was further supported by whole-body BMD assessment of mice acquired by DEXA (Fig. c-d). Altogether, these data suggest that systemic inflammation and decreased mechanical loading at early time points may contribute to the systemic bone loss response, and recovery from this bone loss may be age-dependent.
This study describes a little known and poorly studied bone loss phenomenon that may meaningfully contribute to future fracture risk in osteoporotic subjects. Bone fracture initiates injury-induced systemic inflammation and decreases mechanical loading, both of which can modulate the function of bone cells and negatively affect both bone quantity and bone quality. This bone remodeling response is also likely related to the utilization of mineral from the skeleton for addressing the acute skeletal injury through callus formation. Uncovering the etiology of this phenomenon will allow us to inform treatments aimed at preserving lifelong skeletal health for the aging population.
17:10 - 17:20
We conducted an in-plane fracture analysis of a cortical bone computationally using an extended finite element method (XFEM) within Abaqus. The cortical bone microstructure was represented by several osteons which were perpendicular to the studied transverse plane. For simplicity, osteons, cement lines and interstitial bone were assumed to be linear elastic and isotropic. The accuracy of results was examined by comparing a linear elastic fracture mechanics (LEFM) approach with a cohesive segment (CS) approach and varying the finite element model mesh density, element type, damage evolution, and boundary conditions.
Six multi-osteon cortical bone 2D finite element models were created, where each model had a different mesh density, to investigate the effect of mesh density on results accuracy. To study the effect of finite element type, four-node bilinear plane strain enriched elements (CPE4) and four-node bilinear reduced integration plane strain enriched elements (CPE4R) were used. Three different types of boundary conditions were applied: mixed (displacement- or traction-controlled) and traction boundary conditions. The model was loaded by applying either a prescribed uniaxial displacement or traction.
We found that the increment size and model mesh density can influence simulation results, where using finer mesh or smaller simulation increment size generated unexpected cracks initiations and propagations behavior which in turn affected simulation results accuracy negatively regardless of the problem boundary conditions.
Using CPE4 elements gave more accurate results compared to using CPE4R elements. CPE4R elements decreased the cortical bone crack propagation speed. Therefore, it is recommended to use CPE4 elements when performing cortical bone fracture analyses using the XFEM.
Cohesive segment damage evolution for a traction separation law based on energy versus displacement had a slight effect on the crack propagation path around the osteon cement lines. Similarly, simulating the cortical bone fracture using XFEM and homogeneous constitutive model had an effect on the crack propagation path and speed compared to using a heterogeneous constitutive model. This study also shows that not accounting for different material properties of cortical bone phases will affect the crack propagation path and speed.
LEFM and CS approaches allowed to simulate the multi-osteon cortical bone fracture accurately with the XFEM when using an optimized finite element model and simulation increment size. However, the results obtained from both methods were similar but not identical, with the LEFM approach showing a faster crack propagation compared to the CS approach.
The conclusions mentioned above hold regardless of choice of boundary conditions. The novelty of this study is in taking a more global view on the problem of simulations of fracture of cortical bone and providing guidance to researchers on how to use XFEM to simulate cortical bone fracture more effectively and accurately.17:20 - 17:30
Introduction
Aging and disease substantially modify bone tissue heterogeneity, yet is unclear how fracture toughness (Kc) is altered by spatial variation in bone microscale chemical and/or mechanical properties. Further, relationships between Kc and microscale heterogeneity may depend on bone organization (e.g., lamellar vs central bone). This novel study experimentally evaluated how microscale heterogeneity contributes to bone Kc, and whether these relationships are generalizable across sex, body composition, and exercise status in rats.
Methods
Young female and male Wistar rats (N=64) were fed a high fat diet for 10 weeks and stratified into obese and lean groups (highest and lowest tertiles of weight gained). Obese and lean rats were randomized to 4 weeks of treadmill exercise (15 m/min, 60 min/day, 5d/wk) or sedentary conditions.
Kc was evaluated for notched femurs in three-point bending. Femurs were then dehydrated, embedded in poly(methyl)methacrylate, and polished (0.1µm finish). Nanoindentation arrays of 25 indents each were placed in lamellar and central bone. Raman spectroscopy arrays (25 points) were placed alongside indentation arrays in lamellar and central regions (Figure).
Mean and standard deviation (stdev) were calculated for nanoindentation (reduced modulus, plastic work) and Raman (v2 phosphate:amide III (min:mat), carbonate:phosphate, crystallinity) arrays. Multiple linear regression models were constructed for lamellar and central bone with Kc as the dependent variable and microscale parameters as predictors, and optimized for high r2adj and low error.
Results
For lamellar bone, higher Kc was predicted by increased carbonate:phosphate and decreased stdev(min:mat) and stdev(crystallinity), r2adj = 47%. Other parameters either did not improve the model or interacted with sex, obesity, or exercise (Table).
The same model applied to central bone achieved lower r2adj (11%). Microscale parameters interacted with sex, obesity, and exercise and thus did not generally predict Kc.
Discussion
This work assessed how microscale bone heterogeneity predicts Kc. Tough bone was predicted by hallmarks of bone maturity: increased carbonate:phosphate and reduced stdev of min:mat and crystallinity. These generalizable relationships (not affected by sex, obesity, or exercise) were observed in lamellar but not central bone, further indicating that mature, well-organized tissue is important for Kc. Nanoindentation parameters did not predict Kc, suggesting that bone tissue chemistry is more important for toughness than microscale elastic-plastic properties.
Parameter | P-value | Coefficient |
Carbonate:phosphate | 0.001 | +57.3 |
stdev(min:mat) | 0.001 | -8.43 |
stdev(crystallinity) | 0.009 | -816 |
stdev(carbonate:phosphate) | 0.000 | 187 |
Sex | 0.173 | -0.490 |
Obesity | 0.001 | -0.418 |
Exercise | 0.074 | 0.212 |
stdev(carbonate:phosphate)*Sex | 0.010 | 92.0 |
Exercise*Sex | 0.008 | -0.327 |
Table: Best-fit model to predict Kc for lamellar bone. Bold indicates predictors generalizable across model.
Figure: i) Notched fracture testing ii) regions of interest in lamellar and central bone iii) nanoindentation and Raman 25-point arrays iv) mean and stdev calculated for each array.
17:30 - 17:40
Introduction:
Surgical smoke is a by-product of surgeries which involve electrosurgery, laser ablation, ultrasonic scalpels, high speed drills, burrs and saws. Surgical smoke creates a undesirable odour, reduces visibility and is free to disperse through the operating theatre unless an evacuation mechanism is in place. Studies have demonstrated harmful constituents in surgical smoke [1,2,3] and attribute virus contraction to its inhalation [4]. Studies have attempted to measure surgical smoke particulate size [5,6], but to date, the size and morphology of the contents of surgical smoke, and whether different cutting methods and tissues cause changes to these properties, has not been systematically investigated. The objective of this study is to design an experimental approach to characterize the size, morphology and composition of particulate generated from various biological tissues during cutting with different surgical tools.
Methodology:
In this study, cutting of tissues with electrosurgery, ultrasonic scalpels and bone cutting modalities is carried out. Particles are extracted from surgical smoke via electrostatic precipitation using a custom device. The size, morphology and composition of smoke particulate is examined using Scanning Electron Microscopy (SEM) and Energy Dispersive Spectroscopy (EDS). Computational modelling in COMSOL Multiphysics, which models fluid flow, electric field and particle transport, is used to improve design parameters of an experimental device to optimise collection of the varying sized particulate within surgical smoke.
Results:
The custom electrostatic precipitation device has been designed, assembled and used to collect smoke particulate during surgical cutting. Particulate obtained is then subjected to SEM analysis and EDS for elemental composition determination. Preliminary results from electrosurgical cutting of bovine liver show distinct rounded morphology for the particulate contained in the smoke plume created with particle sizes in the range of 12.8-93.3μm observed (fig. 1). Cutting of bone and other soft tissues will also be carried out as part of this study for characterization of particulate size, morphology and composition.
Discussion:
The size of particles in surgical smoke created by different cutting modalities and tissue types has not been systematically studied. This study will characterize particle sizes, morphology and composition and compare particulates created by cutting different tissue types with various cutting modalities. This information may increase the awareness of the risks that exposure poses to health. Future work will involve further model development and validation.
References:
[1] Romano (et al.), Int. J. Environ. Res. Public Health 14:137, 2017. [2] Al Sahaf (et al.), Ir J Med Sci 176:229–232, 2007. [3] Mowbray (et al.), Surg Endosc 23:3100–3107, 2013. [4] Hallmo (et al.), Eur Arch Oto-rhino-laryngology 248:425–427, 1991.[5] Douglas (et al.), J Am Assoc Gynecol Laparosc 5(1):29–32, 1998. [6] Nezhat (et al.), Lasers in Surg and Medicine 7:376–382, 1987.
17:40 - 17:50
Introduction: Recent studies have reported a higher net energy cost of walking (NetCw) in obese compared to lean individuals when is expressed per kilogram of body mass (1). However, the metabolic cost of the biomechanical factors should have led to a higher metabolic rate than the observed 10% (2). Some authors have hypothesized that this may be due to an improvement in the pendular transduction kinetic-potential energy (Recovery), as it was shown in African women (3). However, this increase was not found in obese adults walking at slower preferred walking speed compared with lean counterparts (4). Hence, obese individuals may optimize the storage-release of elastic energy during walking [assessed by vertical stiffness (5)] to minimize the increase in NetCw. Therefore, the purpose of this study was to investigate and compare energy-saving walking mechanisms (i.e., recovery and vertical stiffness) and their influence on the NetCw in obese versus lean individuals.
Methods: Net energy cost of walking (NetCw), spatiotemporal parameters, external work (Wext), mechanical energy saved via inverted pendulum-like behavior of walking (Recovery), vertical stiffness (Kvert), elastic potential energy (EE) and net locomotor efficiency were computed for thirteen lean (L; 29.0±5.8 yr; BMI: 21.9±1.5 kg.m-2) and thirteen obese subjects (O; 32.7±7.9 yr; BMI: 33.8±2.5 kg.m-2) matched for age and height during walking on an instrumented treadmill at five speeds.
Results: No significant difference was found between groups in relative (per kg of body mass) NetCw (P=0.13, Fig.1A). Relative positive Wext (Wext+) was higher in L than in O at speeds of 1.11, 1.39 and 1.67 m.s-1 (P≤0.003), whereas Recovery was lower at speeds of 1.39 and 1.67 m.s-1 (P≤0.01, Fig.1B). No differences were found between groups in relative Kvert (P=0.11) and EE (P=0.41, Fig.1C). Net locomotor efficiency was significantly higher in L than in O (P=0.02) with a significant difference found at 1.11, 1.39 and 1.67 m.s-1 (P≤0.03).
Conclusion: The present results reveal that obese individuals have similar elastic potential energy and vertical stiffness per kg of body mass with higher recovery at fastest speeds. Therefore, obese adults rely more on the pendular mechanism, rather than on the storage-release of elastic energy, for decreasing the amount of Wext+, and this may limit the increase in the net energy cost of walking.
References:
1. Peyrot N., et al., (2009). J Appl Physiol,106(6):1763-70.
2. Browning RC., et al., (2006). J Appl Physiol, 100(2):390-8.
3. Heglund NC., et al., (1995). Nature, 375(6526):52-4.
4. Malatesta D., et al., (2009). Med Sci Sports Exerc, 41(2):426-34.
5. Hong H., et al., (2013). J Biomech, 46(1):77-82.