Airway flows and lung transport 1

14:20 - 15:50 Thursday, 12th July, 2018

Liffey MR2

Track Biofluid and Transport

Posters for this session are on display on Thursday 12th July in Liffey A.

Chairs: Cahit Evrensel and Mihai Mihaescu

P4500 Upper Airway Flow Characteristics of Obstructive Sleep Apnea Patients who underwent Uvulopalatopharyngoplasty

Yan Shang1, Jingying Ye2,1, Song Fu3
1School of Clinical Medicine, Tsinghua University, Beijing, China. 2Beijing Tsinghua Changgung Hospital, Beijing, China. 3School of Aerospace Engineering, Beijing, China

Abstract

Introduction

    Obstructive sleep apnea(OSA) is one of most common sleep breathing disorders. Surgeries, such as mandibular advancement splints (MAS) and uvulopalatopharyngoplasty(UPPP), are perceived as effective treatment to anatomy abnormality due to their success in enlarging velopharyngeal region. Previous study[1] showed that  computational fluid dynamics(CFD) simulation can reflect anatomical defects and its result was highly correlated with clinical data scuh as apnea hypopnea index(AHI). However, the correlation is not proved to be existed for other types of treatment and it is weak for our clinical samples, which are OSA patients who underwent UPPP. Besides, the neuro-muscular activity plays a fairly important role in OSA and should not be neglected[2]. Thus, we combine fluid mechanics and neuro-muscular physiology to raise a new perspective to explain pathology of OSA and evaluate efficiency of UPPP.


Methods

    Seven OSA patients were selected randomly form Beijing Tsinghua Changgung Hospital with one-night polysomnography(PSG) before and after UPPP. 3D upper airway structures were reconstructed from CT scan of each patient. We used a commercial CFD software(CFX, ANSYS) to simulate the airflow for a given respiratory condition. Correlation analysis was performed among CFD data and clinical data, such as maximum velocity, minimum wall pressure, apnea hypopnea index(AHI). We calculated average wall pressure around velopharyngeal region and introduced a new parameter, which equals average wall pressure divided by total pressure loss. A pneumootachometer was connected to a face mask. The mask was also attached to a device that can deliver continuous negative pressure. We used the mask to control subjects’ inhaling speed with different negative pressure and recorded the pharyngeal electromyography(EMG).


Results

    The result shows no significant correlation(p>0.05) between AHI and conventional flow parameters that had been used in previous studies. But ratio of the new parameter pre- and post UPPP shows strong correlation(p<0.01) with ratio of AHI pre- and post UPPP for each patient.  With increasing mask negative pressure, the EMG rises proportionaly.
Uncaptioned visual


Discussion

    The parameter we firstly introduced here represents an effort that the muscle around velopharyngeal region must make to keep upper airway open. The higher this parameter is, the more muscular response is required to make for patency. Due to the damped muscular activity, upper airway collapse will happen when a patient is asleep if the parameter exceeds the range of the body can afford. Thus, it can be seen as a compensatory coefficient that is correlated with anatomy abnormality which can be corrected by UPPP.


References

1.Zhao M, Barber T, et al., (2013). Journal of biomechanics, 46(1): 142-150

2.Mezzanotte W S, Tangel D J, et al., (1992). Journal of Clinical Investigation, 89(5): 1571


P4501 Comparative study of grid generation methods for the simulation of nasal airflow during a sniff

Mr Shinya Kimura1, Mr Takashi Sakamoto1, Mr Syuta Miura1, Dr Toshihiro Sera2, Dr Kenji Ono3, Dr Gaku Tanaka1, Dr Denis J. Doorly4, Dr Robert C. Schroter5
1Department of Mechanical Engineering, Chiba University, Chiba, Japan. 2Department of Mechanical Engineering, Kyushu University, Fukuoka, Japan. 3Research Institute for Information Technology, Kyushu University, Fukuoka, Japan. 4Department of Aeronautics, Imperial College London, London, United Kingdom. 5Department of Bioengineering, Imperial College London, London, United Kingdom

Abstract

Introduction
Computational fluid dynamics (CFD) recently enabled detailed simulation of airflow to be performed throughout the human nasal airways based on an individual subject’s computed tomography (CT) scans, allowing flow disribution, and other physiologically related parameters that are difficult to measure directly, to be deduced. However, few studies have focused on the transient processes in nasal airflow. Bates et al. investigated the airflow patterns and instability during a sniff using direct numerical simulation (DNS) and reported that the spontaneous fluctuations in nasal airflow occur, resulting from shear layer instabilities. The present study describes a new approach to simulate the transitional nasal airflow using voxel-based modeling with Cartesian grids. The shear layer instability was investigated to compare the results of this Cartesian grid method with those of the conventional boundary-fitted grid method.

Methods
The nasal cavity model with uniform Cartesian grids was obtained from the grid partitioning of the same nasal polygon model used previously by Bates et al.. The Cartesian grid size was set to 0.05 mm based on the Kolmogorov length scale, corresponding to the viscous length scale from the wall y+=0.85. The total number of grids was approximately 7.5 billion. For the simulation of nasal airflow during a sniff, the governing equations for the conservation of mass and momentum in 3D incompressible unsteady flow were solved using FFV-C ver.2.1.5 developed at RIKEN. As a boundary condition, volumetric flow rate used by Bates et al. was imposed. The large-scale parallel simulation was performed on the K computer. The time step was 8*10-7 sec.

Results and Discussion
Despite the simple approach using Cartesian grids, the present method accurately reproduced rapid change in the characteristic flow structure in a nasal cavity, with a jet posterior to the nasal valve, a recirculating flow in the upper anterior region, and an unstable flow in the olfactory region. In particular, flow separation was reproduced at the superior edge of the nasal valve, and the breakdown of separated shear layer with flow instability was observed. Resultant flow fluctuations were discussed in detail, and good agreement was observed between the results of the Catesian grid method and those of the boundary-fitted grid method.

Uncaptioned visual
Fig.1:
 Contours of vorticity magnitude on sagittal plane in the right nasal cavity.

Acknowledgements
The present study was supported by JSPS Bilateral Program and JSPS KAKENHI Grant Number JP26630059. This research used computational resources of the K computer provided by the RIKEN Advanced Institute for Computational Science through the HPCI System Research project (Project ID:hp160186, hp170140)

References
Bates AJ, Doorly DJ, Cetto R, Calmet H, Gambaruto AM, Tolley NS, Houzeaux G, Schroter RC, Dynamics of airflow in a short inhalation, J R Soc Interface, 12(2014), 1-15.


P4502 Numerical study of ventricular folds effects on phonation aerodynamics

Mr Hossein Sadeghi, Dr Stefan Kniesburges, Dr Anne Schuetzenberger, Prof Dr Michael Doellinger
Department of Phoniatrics and Pediatric Audiology at the Department of Otorhinolaryngology, Head and Neck Surgery, University Hospital Erlangen, Medical School at Friedrich-Alexander University Erlangen-Nuremberg, Erlangen, Germany

Abstract

Introduction

The human phonation process is a multidisciplinary process that is the result of the interaction between tracheal airflow and the oscillating vocal folds (first constriction), figure 1. Immediately above the vocal folds, the ventricular folds (VeFs) build the second constriction in the larynx. This structure rarely vibrates during normal phonation. The objective of this study is to investigate numerically the effects of VeFs on the laryngeal aerodynamics and the aerodynamic phonation efficiency.

Methods

Large eddy simulations were performed using the Finite volume method to model laryngeal air flow. A three-dimensional simplified larynx model based on a synthetic model was employed as shown in figure 1. Vocal folds oscillations were externally imposed. The oscillation pattern was adapted from experimental results and exhibits the characteristic convergent-divergent mucosal wave-like motion as seen in humans. Cases with and without VeFs were simulated and flow patterns and quantities were compared. 

Results

The presence of VeFs caused a straightening and elongation of the glottal jet in the supraglottal region. Furthermore, a higher pressure drop across the glottis and decreased pressure values at the core of the glottal jet and in the ventricles could be detected in the case with VeFs. These two effects are the result of the insulation of the ventricle volumes between the vocal folds and VeFs from the region downstream of the VeFs. Flow resistance (ratio of pressure drop to mean flow rate) were calculated along the whole larynx and solely along the glottal constriction. A decreased laryngeal flow resistance was observed synchronously to increasing glottal flow resistance by adding VeFs. As a consequence, aerodynamic forces exerted by the flow on the medial and superior surfaces of vocal folds were enhanced.

Uncaptioned visual

Fig. 1: Schematic of the larynx model and an instantaneous velocity magnitude contours with streamlines in the mid-coronal plane.

Discussion

Summarizing the effects described above, the presence of the VeFs increased the aerodynamic efficiency of the simulated phonation process. Owing to the large pressure drop in the ventricles, a much larger pressure difference across the vocal folds and therewith a higher energy of the glottal flow is present. Subsequently, the increase in the glottal flow resistance indicates an increase of energy transfer rate between flow and vocal folds which causes a higher aerodynamic force on the vocal folds. On the other hand, the VeFs reduces the laryngeal flow resistance owing to a decrease of the aerodynamic mixing related loss of the glottal jet. In conclusion, the results showed evidence that the VeFs support and enhance the fluid-structure interaction between laryngeal airflow and vocal folds by purely aerodynamic effects.


P4503 Procedure for geometry regularisation to separate the effects of torsion and curvature on flow structure

Jan N Rose1, Qiwei Xiao1, Charlotte McIntyre1,2, Neil S Tolley2, Denis J Doorly1
1Department of Aeronautics, Imperial College London, London, United Kingdom. 2Faculty of Medicine, Imperial College London, London, United Kingdom

Abstract

Introduction
The energy required to drive airflow in the large airways from nose or mouth to the carina is affected both by the airway lumen area and the centreline curvature. In the case of tracheal airway compression due to retrosternal goitre, the severity of pathology is commonly assessed on the basis of the minimum lumen area. Extreme compression generally results in airways that are significantly curved and twisted, so that factors other than simply the passage area may affect the flow. Bates (2016) analysed the effect of curvature and constriction by comparing pathological airways to those of a healthy subject. Other investigators like Brouns (2007) start with an already idealised airway as a basis to investigate the effect of varying the severity of a tracheal stenosis. In order to separate the effects of centreline distortion from those associated with passage area variation, a procedure to straighten and untwist airway conduits was developed. The created "regularised" geometry facilitates analysis of airway loss mechanisms.

Methods
An airway geometry was segmented using Mimics (Materialise, Leuven, Belgium) and its centreline curve derived using VMTK. We then transformed the geometry to construct a straightened and untwisted lumen whilst preserving not only the distribution of cross-sectional area but its detailed shape. Additionally, an axisymmetric model was created where only the cross-sectional area distribution was matched. Computational fluid dynamics (CFD) simulations of inspiratory flow in the three geometries were performed using an LES (large eddy simulation) model (Star-CCM+, Siemens, Melville, NY, USA) to resolve flow structures and to study the mechanisms of energy loss.

Results
Figure 1 compares the unmodified, regularised, and axisymmetrically idealised geometries. Despite the maximum centreline deviation being only 1.76cm, the flow structure was found to be significantly different in all three cases. Although regularising the geometry preserves the straight centreline path of an axisymmetric idealization, the introduction of significant asymmetry changes the nature of jet breakdown downstream of narrowings; curvature and torsion serve to enhance wall impact.

Uncaptioned visual
Figure 1: Instantaneous streamlines coloured by vorticity for original (top), regularised (middle), and axisymmetric (bottom) geometries.

Discussion
CFD is becoming more widely used to assess pathological flows and the role of geometry is well recognised as a primary determinant of quantities such as shear stress and losses, which can be linked to breathing difficulty for patients. However, the cost of highly resolved CFD simulations is such that alternative procedures to estimate losses based on measurable characteristics are desirable. The proposed methodology for deriving new simplified geometrical representations aims to understand the confluence of various factors, leading to the development of efficient surrogate models.

References
1. Bates AJ, et al., Respir Physiol Neurobiol 234:69-78,2016.
2. Brouns M, et al., J Appl Physiol 102:1178–1184,2007.

P4504 Chaotic features of oscillatory flow in expanding and contracting pulmonary acinus

Takashi Mizutani1, Yuri Inagaki1, Yoshimasa Miyachi1, Toshihiro Sera2, Gaku Tanaka1
1Department of Mechanical Engineering, Chiba University, Chiba, Japan. 2Department of Mechanical Engineering, Kyushu University, Fukuoka, Japan

Abstract

Introduction
Lung diseases such as pulmonary adenocarcinoma are, in most cases, caused by the deposition of inhaled particles within the lung. Locations of these diseases are closely related to the airflow patterns in the lung airways . Drug delivery systems via the lung are being developed, and thus, airflow patterns are considered a key factor in predicting the transportation of drug particles. Sera et al. established a method for visualization of the soft tissue in the small airways of the mouse lung using a high-intensity synchrotron radiation system (SPring-8) and elucidated morphological changes and local compliance accompanying respiration in these airways. In the present study, we investigate the chaotic features of flow in expansion and contraction of true-geometry pulmonary acinus by numerical simulation of the oscillatory flow in a threedimensional pulmonary acinus model constructed from high-intensity synchrotron radiation CT images.

Methods
Using a model of multi-branching pulmonary acinus in which moving boundary conditions induce expansion and contraction, we visualize and assess the fluid particle trajectory in order to investigate the effects of acinus expansion and contraction.The overall configuration of the acinus was assumed to remain self-similar throughout the expansion and contraction cycle, and the volume change was taken as a moving boundary problem given by the sinusoidal function. The two expansion–contraction conditions were based on the relation between the tidal volume of respiration and the residual air volume in the lungs at the end of normal and deep expiration.The OpenFOAM software library was used for calculation of the fluid particle trajectory in the acinus model. To examine the chaotic features of flow, the largest Lyapunov exponent was then evaluated. When the largest Lyapunov exponent is positive, the flow is chaotic.

Results and Discussion
The largest Lyapunov exponent was dependent mainly on the aiway generation and was changed in response to the expansion–contraction volume. It was also found that the value of the largest Lyapunov exponent was positive in the vicinity of primary branch, while the value was negative deep in the acinus. These results indicate that the oscillatory flow induced by expansion and contraction in pulmonary ainus is locally chaotic. In the vicinity of primary branch, a circulation flow was formed within and confined to the alveolus. It is suggested that the periodic formation and extinction of circulation flow in the alveolus plays an important role in the chaotic behavior of oscillatory flow.

Uncaptioned visual

Fig. 1 Temporal variation of streamline at locations A, B, C and D.

References
Sera T, Yokota H, Tanaka G, Uesugi K, Yagi N, Schroter RC, Murine pulmonary acinar mechanics during quasi-static inflation using synchrotron refraction-enhanced computed tomography, J Appl Physiol, 115(2013), 219-228.


P4505 Effect of groove volume on effective diffusivity of carbon dioxide through oscillatory flow in a pipe with circumferential grooves modeled after a trachea

Mr Akihiro Shimizu1, Dr Masashi Shimizu2
1National Institute of Technology, Tokyo College, Tokyo, Japan. 2Tokyo Institute of Technology, Tokyo, Japan

Abstract

Introduction

   Experiments to obtain effective diffusivity of carbon dioxide in oscillatory flow through a straight pipe have been carried out by Joshi, et al.1) and the strict solution of effective diffusivity in a straight pipe has been derived by Watson2) for laminar oscillatory flow. The best method to obtain effective diffusivity has been developed by Shimizu, et al. 3) In a trachea, there are circumferential grooves of periodic cartilage, and we suppose that groove volume of the circumferential grooves may increase the mass transfer performance. In this paper, the effect of the groove volume in a pipe with circumferential grooves is examined.

Experimental set-up and procedure
   The pipe is composed of aluminum rings of inner diameter of 18mm and bottom diameter BD=22, 26, 30, 38mm, the depth of grooves is 2, 4, 6, 10mm, respectively. At the carbon dioxide introducing point, pure carbon dioxide is introduced into the pipe at the lower dead point of the piston, and the carbon dioxide concentration is measured at the measuring point which is 800mm away from the introducing point. Extracting each datum in the carbon dioxide concentration change corresponding to the introducing phase, the effective diffusivity is calculated from the relationship between carbon dioxide concentration and time.

Results

   On the condition of tidal volume V=80mL, effective diffusivities are shown in Fig.1 for several groove widths W of 2, 5, 10, 15, 20 and 30mm. 
Uncaptioned visualFig.1 Effective diffusivity against the Womersley number α(=a√(ω/v))(solid line means the theoretical value by Watson2)

For frequency f=6Hz, tidal volume V=80mL, the ratio of the groove volume against the core flow volume part of the pipe are illustrated in Fig.2 and the graph of effective diffusivity against the ratio of Vg/Vc is shown in Fig.3.

Uncaptioned visual
Fig.2 Groove volume Vg and core flow volume Vc
Uncaptioned visual
Fig.3 Effective diffusivity vs the ratio of groove volume against the core volume

Discussions

  The effective diffusivity is proportional to the groove depth. The maximum effective diffusivity occurs for a groove depth of 10mm. Effective diffusivity increases and decreases during the increase of the ratio of the groove volume against core flow volume.

References

1               Joshi,C.H., et al.,“An experimental study of gas exchange in laminar oscillatory flow”,J. Fluid Mech,Vol.133(1983),pp.245-254.

2               Watson,E.J.,“Diffusion in Oscillatory Pipe Flow”,Journal of Fluid Mechanics,Vol.133(1983),pp.233-244.  

3               Shimizu,A, Shimizu,M, Sugawara,M, Transition to Turbulence and Gas Transport in the Oscillatory Flow through a Straight Circular-Cross-Sectional Pipe, Trans. JSME, Series(B),Vol.78(2012), No.785,pp.17-26(in Japanese).


P4506 Form, flow and function in the nasal airways.

Mr Qiwei Xiao1, Professor Denis Doorly1, Dr Alister Bates2, Dr Lulu Ritchie1,3, Dr Raul Cetto1,3, Professor Robert Schroter4, Professor Neil Tolley3
1Aeronautics Department, Imperial College London, London, United Kingdom. 2Cincinnati Children's Hospital Medical Center, cincinnati, USA. 3Faculty of Medicine, Imperial College London, London, United Kingdom. 4Bioengineering Department, Imperial College London, London, United Kingdom

Abstract

Form, flow and function in the nasal airways

Introduction.

Nasal airway geometry is highly variable both inter- and intra-subject. The nose performs the essential functions of warming and humidifying inspired air [1], however, the overall performance and the relative contribution of different parts of the nose to these functions depends on the subject geometry [2]. This investigation compares the relative contributions of different parts of the nasal mucosa towards achieving these functions, with the variability in performance assessed considering a range of subject geometries.

 Methods.

20 nasal geometries were obtained from healthy subjects via MR imaging (with local ethics board approval) and segmented using a commercial image processing package: Mimics Research 18.0. Computational fluid dynamics (Star-CCM+ Siemens, Melville, NY, USA) was applied to determine the distributions of inspiratory airflow and the associated wall shear stress, heat and water transport for each geometry [2]. The airway surface was divided into a series of contiguous regions, enabling the local average tissue exchange burden to be derived.

Results.

During inspiration at moderate inflow, on average the highest rates of heat and mass exchange were located in the anterior region, between the nasal valve and the anterior head of the middle turbinate, although considerable variability in individual patterns of exchange was observed, Figure 1. Vertically, the lower part of the nasal cavity such as middle and inferior turbinate predominantly contribute to heat and mass exchange. This is consistent with the finding of how flow is partitioned between areas, where the majority of the flow passes through the middle and inferior cavity. For a given flow rate, heat and water exchange varies from around 0.25 times the cavity mean to 2.5 times the cavity mean across all 20 geometriesUncaptioned visual

Figure 1:  Instantaneous streamlines colored by relative humidity.

Discussion.

Computational simulation enabled the impact of changes in geometry on airflow distribution and the varying burden of heat and mass exchange placed on different parts of the nasal mucosa to be assessed.  Although some of the overall trends, such as the effect reducing of nasal cavity cross-sectional area on the airway resistance are as expected, the analysis allows an objective quantitative comparison to be made of the relative contribution of different parts of the nose to the fulfillment of key physiological functions.

References.

  1. Bates, A.J., Doorly, D.J., Cetto, R., Calmet, H., Gambaruto, A.M., Tolley, N.S., Houzeaux, G. and Schroter, R.C., 2015. Dynamics of airflow in a short inhalation. Journal of the Royal Society Interface12(102), p.20140880.
  2. Garcia, G.J., Bailie, N., Martins, D.A. and Kimbell, J.S., 2007. Atrophic rhinitis: a CFD study of air conditioning in the nasal cavity. Journal of applied physiology103(3), pp.1082-1092.

P4507 Effect of virtual surgery of the ventricular folds on the airflow through the human respiratory tract

Mr Samuel Voß1, Dr Christoph Arens2, Mr Efstathios Papatsoutsos2, Dr Gábor Janiga1
1Laboratory of Fluid Dynamics and Technical Flows, University of Magdeburg “Otto von Guericke”, Magdeburg, Germany. 2Department of Otorhinolaryngology, Head and Neck Surgery, University Hospital, Magdeburg, Germany

Abstract

Introduction

Investigations of fluid dynamics associated with phonation and speech may play a crucial role in order to improve the treatment of voice disorders. The generation of sound is a complex interaction of fluid dynamics, structural dynamics and acoustics inside the larynx. In the past, experimental setups and computer simulations have contributed to the understanding of underlying mechanisms [1]. A particular advantage of these methods is that different treatment options can be analysed in advance without risks for patients. Therefore, the present study focuses on the role of ventricular folds removal on the human inspiration process. This simulated removal can be part of a surgical procedure in cancer patients.


Methods

In accordance to local ethics committee a CT data set of a patient with no pathological events in the region of interest underwent geometry segmentation. The resulting surface mesh contains the respiratory tract from the trachea to the nostrils with open vocal folds, see Fig. 1a. The virtual removal of the ventricular fold is performed manually leading to four different configurations: initial state, surgical removal of the left, right, and both ventricular folds, see Fig. 1b-e. Each configuration is meshed as single computational domain using approx. 8 million finite volume cells. All transient simulations are performed using STAR-CCM+ (Siemens Product Lifecycle Management Software Inc., Plano, TX, USA) based on Large Eddy Simulation using the WALE subgrid-scale model.


Uncaptioned visual

Fig. 1: Visualization of the simulation domain and the location of the ventricular folds in the human respiratory tract (a). The considered configurations include the b) initial state, surgical removal of the c) left, d) right, and e) both ventricular folds.


Results and Discussion

The resulting flow fields of the four configurations are compared qualitatively and quantitatively. Velocities inside the glottis region reach up to 10 m/s (for normal human breathing). Since the glottis plane represents the narrowest section in the respiratory tract, large fluctuations of the flow field are present in this region. Comparing the different configurations, removal of ventricular folds leads to changes in the local flow characteristics. This causes local differences in the wall shear stress distribution as well. Whether the observed phenomena is related to events such as dehydration and inflammation, affecting the clinical outcome for the patient, needs further investigation.

References

1.         Mittal, R., et al., (2013). Annu Rev Fluid Mech, 45 p437


P4508 A Statistical Shape Model of the Human Nasal Cavity

M.Sc. Jan Brünung1, Dr. med. Thomas Hildebrandt1, Matthias Bindernagel2, Natalja Amiridze2, Dr. Hans Lamecker2, Dr. Stefan Zachow3, PD Dr. Leonid Goubergrits1
1Charité – Universitätsmedizin Berlin; Institute for Imaging Science and Computational Modelling in Cardiovascular Medicine, Berlin, Germany. 21000shapes GmbH, Berlin, Germany. 3Zuse Institute Berlin, Department for Visual Data Analysis, Berlin, Germany

Abstract

Introduction: Impairment of nasal respiration often has a severe impact on the quality of life. Although up to thirty percent of the population are affected by impaired nasal respiration, the current state of functional diagnostics is unsatisfactory. Existing approaches only assess integral measures as the nasal resistance for each side of the nose. No spatially resolved information on the location of an increased resistance within the complex nasal cavity is available.

Furthermore, no generally accepted concept of a healthy nasal airflow has been established as of yet. Numerical flow simulations allow calculation of respiratory flow fields in patient-specific nasal geometries, allowing identification of common flow features and parameters associated with perception of impaired nasal breathing [1].

Due to the enormous heterogeneity featured by individual nasal cavity geometries, it is difficult to compare results between subjects and to identify common flow features. In this study a statistical shape model (SSM) for the nasal cavity was proposed to address this problem. A SSM allows automatization of the segmentation procedure and a mathematical description of the nasal shape variation. However, the first focus was to show, that the mean geometry generated using a SSM of a healthy nasal cavity results in a flow field similar to those observed in patient-specific simulations.

Methods: 30 CT data sets of the nasal cavity of subjects who did not report any respiratory impairment were segmented using the software ZIBAmira. From these 30 geometries with a common parameterization a SSM was generated using an approach described earlier [2]. Using this SSM a mean geometry of all geometries was generated. Airflow within this geometry was calculated using STAR-CCM+. A steady mass flow rate of 12 l/min was specified.

Results: The mean surface generated using the SSM features two nearly symmetric sides of the nose, with a volume difference of 0.6%. The majority of the airflow passes through the middle meatus as described by Taylor et al. [3]. The flow resistances of both sides of the nose were R = 0.047 Pas/ml, lying within the range calculated using the patient-specific geometries.

Discussion: Flow fields calculated using this geometry show common features observed within the simulations performed on individual geometries of healthy subjects. However, the airflow calculated within the mean geometry of a sample of healthy subjects is not necessarily a representation of the average airflow within a healthy nasal cavity. The bigger advantage of the SSM is, that it allows to map patient-specific data from different subjects onto the same geometry, which will be the next step.

Literature

[1] Zhao et al.; 2014; doi:10.1002/lary.24265

[2] Kainmueller et al.; 2009; doi:10.1109/IEMBS.2009.5333269

[3] Taylor et al.; 2010; doi:10.1098/rsif.2009.0306


P4509 Rheological characterization of native human mucus

Duygu L. Tuna1,2, Altay Ünal3, Elif Şen4, Koray Ceyhan5, Fatma Çiftci4, H. Barbaros Özer6, Sevgi Saryal4, Sehribani U. Oktay7, Cahit A. Evrensel7,8
1Department of Physics, College of Science, Ankara University, Ankara, Turkey. 2Physics Group, College of Engineering, Atılım University, Ankara, Turkey. 3Department Physics Engineering, College of Engineering, Ankara University, Ankara, Turkey. 4Department of Pulmonary Diseases, School of Medicine, Ankara University, Ankara, Turkey. 5Department of Pathology, School of Medicine, Ankara University, Ankara, Turkey. 6Department of Dairy Technology, College of Agriculture, Ankara University, Ankara, Turkey. 7Department of Mechanical Engineering, College of Engineering, University of Nevada, Reno, NV, USA. 8Department of Biomedical Engineering, College of Engineering, Ankara University, Ankara, Turkey

Abstract

Introduction

Mucus is a viscoelastic gel with common rheological properties of both solids and liquids because of the cross-linked network contributed by physical entanglement between the glycoproteins, lipids, proteins, DNA and water (Hamed & Fiegel, 2014). In Chronic Obstructive Pulmonary Disease (COPD) and bronchiectasis, the pathologic mucus thickens and its viscosity increases because of the inflammation. Changes in the rheology of mucus cause the ciliary clearance mechanism to lose its effectiveness which may enhance airways obstruction.   Thus sputum clearance by cough becomes critical.   Rheology of the mucus contributes to understanding of both clearance mechanisms in the airways. In this study, rheological measurements of native mucus collected from patients are presented.

Materials and Methods

According to Anthonisen criteria (Anthonisen et al, 1987) sputum was collected from patients with COPD and bronchiectasis who had at least one of symptoms such as newborn cough and sputum, increased amount of sputum and purulence with increased dyspnea by cough and sputum sample. After separating the sputum sample from the saliva, it was divided into 2 pieces, one for the cytological  examination to evaluate  specimen adequacy by examining numerous  pulmonary macrophages, and the other was stored at -80 °C for potential rheological measurements based on suitability. 

Rheological properties of sputum collected from patients are measured using a 40 mm parallel plate on the shear rheometer (Kinexus pro+ ;Malvern Instruments; Worcestershire; UK) in the frequency range of 0.1-10 Hz after determining the linear viscoleastic region (LVER) based on the amplitude sweep test.

Results

Sample viscoelastic behaviors, G’(storage modulus)  and  η’(viscosity), for COPD and bronchiectasis patients are shown in Figure 1. 


Uncaptioned visual
a) COPD


Uncaptioned visual

b) Bronchiectasis

Fig. 1: Viscosity (η’) and shear (storage) modulus (G’) vs frequency graphs of the native mucus collected from two different patients with a) COPD and b) bronchiectasis

Although magnitudes maybe different general viscoelastic behavior shows moderate increase in elastic modulus and sharp decrease in viscosity with increasing frequency for both illnesses.  This behavior has been shown to be very important in designing means of increasing sputum clearance effectiveness by cough in laboratory tests using mucus simulants with similar behavior (Ragavan et al, 2010).

Acknowledgement:

This study was funded by European Union through 2236 Co-Funded Brain Circulation Scheme.


References 

  1. Hamed, R., & Fiegel, J. (2014). Synthetic tracheal mucus with native rheological and surface tension properties. Journal of Biomedical Materials Research - Part A, 102(6), 1788–1798. https://doi.org/10.1002/jbm.a.34851
  2. Ragavan, A. J., Evrensel, C. A., & Krumpe, P. (2010). Interactions of airflow oscillation, tracheal inclination, and mucus elasticity significantly improve simulated cough clearance. Chest, 137(2), 355–361. https://doi.org/10.1378/chest.08-2096
  3. Anthonisen NR, Manfreda J, Warren CP et al. (1987) Antibiotic therapy in exacerbations of chronic obstructive pulmonary disease. Ann Intern Med;106(2):196-204

P4510 Effect of Surfactant on Split and Rupture of a Liquid Plug at Lung Airway Bifurcation

Hideki Fujioka1, Metin Muradoglu2, Shuichi Takayama3, Jean Nemzek4, James Grotberg4
1Tulane University, New Orleans, USA. 2Koc University, Istanbul, Turkey. 3Georgia Tech, Atlanta, USA. 4University of Michigan, Ann Arbor, USA

Abstract

Introduction

A thin liquid layer covers the inner surfaces of the lung airway. This liquid layer is unstable and forms a plug resulting from a capillary instability if the thickness of liquid film is sufficiently large. When lung-surfactant availability is reduced, this occurs more likely particularly near the end of expiration in distal airways, causing the airways to close because of plug formation. Once formed, the liquid plug propagates driven by inhaled air and eventually ruptures. Pulmonary epithelial cells may be damaged by mechanical stresses associated with the plug motion and its rupture [1]. Also, liquid is instilled into the pulmonary airways in some medical treatments such as surfactant replacement therapy (SRT), partial liquid ventilation (PLV), and drug delivery [2]. 

Uncaptioned visualUncaptioned visual
Fig.1 The split of liquid plug at bifurcating tube.

Method

The moving particle semi-implicit (MPS) method is Lagrangian particle method to solve the Navier-Stokes equations. This method is particularly advantageous for the problems with large deformations and topological changes of interface. We successfully utilized this method to simulates the surface-tension dominant flows coupled with the transport of surfactant [3]. In this study, we applied the method to the three-dimensional problems.

Results and Discussion

In this study, we investigated the split of a liquid plug in a bifurcating tube as shown in Fig.1, where the plug propagates from the parent tube towards the bifurcation. Without surfactant, the plug split asymmetrically at a slightly asymmetric bifurcation because of the larger flow rate on lower resistance branch. The ratio of the plug splitting was notably large despite that the difference in resistance between two daughter tubes was small.  When surfactant presents, however, the plug split and propagated nearly symmetrically for each branch. When the volume of plug is small, the plug ruptures at the bifurcation and causes large mechanical stresses, which were also observed near the bifurcation carina where the air-liquid interface hits.

Acknowledgement

This works was supported by NIH grant R01HL136141.

References

[1] Fujioka, H. and Grotberg, J.B., J Biomech. Eng. Vol. 126, pp.567-577 (2004)

[2] Filoche, M, et. al, PNAS, Vol.112, pp. 9287–9292 (2015)

[3] Fujioka, H., J. Comput. Phys. Vol. 234, pp 280-294 (2013)


P4511 Development of CFD methodology to quantify aerosol leakage percentage of N95 respirators

Neha Sharma1, Gavin D'Souza1, Dr. Matt Myers2, Dr. Suvajyoti Guha2, Dr. Rupak Banerjee1, Dr. Prasanna Hariharan2
1University of Cincinnati, CINCINNATI, USA. 2Food and Drug Administration, silver spring, USA

Abstract

INTRODUCTION

        Respirators constitute an important line of defense against hazardous bio-aerosols, in the event of a pandemic or bio-terror attack. Fit testing of respirators is very essential in order to prevent exposure to harmful bioaerosols. It improves the effectiveness of respirators against aerosol leakage through gaps that are formed between the face and the respirator. However, during such situations of public health emergency fit testing of respirators may not be logistic. Penetration of aerosol particles through N95 respirators has been widely studied, however, analysis of aerosol leakage through leak-sites formed by realistic face and respirator combinations is still lacking. This research presents a computational fluid dynamics (CFD) approach to quantify the aerosol leakage % through respirators for different face-respirator combinations. Risk assessment model by Myers et al. (Math Med Biol. 2016 Oct 25. pii: dqw018.) links respirator leakage to likelihood of infection to the population.


 METHODS

      Center for Disease Control’s anthropomorphic face geometries were CT scanned after donning different respirators and converted to CFD meshes using image-reconstruction and meshing software (3-Matic). The reconstruction process involved thresholding, region growing and post-processing. Acceptable mesh independency was achieved with an average number of 20 million elements. Subsequently, a 3-step numerical methodology (Ansys CFX) was developed to simulate air flow and particle-transport around the face-respirator geometry. The amount of aerosol leakage through the gaps, formed due to poor face-mask fitting was quantified as a function of flow rate. The leakage results in addition to the anatomical leak sites and gap surface areas were then input to the risk assessment model.


RESULTS

        The study accomplished development of a CFD numerical methodology, thereby validating experimental aerosol leakage with an average error of 13%, 11%, and 23% across different headforms with respirators R1, R2, and R3, respectively, at a physiological breathing rate of 10 liter/min. Similar results were obtained for an exercising breathing rate of 70 liters/min. The results showed that the percentage of flow leakage is related to the gap area in a near-logarithmic fashion. The gap area ranged from 0.2% to 3% of the total mask surface area (150 cm2), while the corresponding flow leakage ranged from 43% to 97% respectively. However, the aerosol leakage % does not show any apparent dependence on gap surface area. Variation of aerosol leakage with gap locations showed that controlling nose gap is critical in improving fit-factors for these respirators.

         Uncaptioned visual


CONCLUSION
        The risk assessment model by Myers et al. (Math Med Biol. 2016 Oct 25. pii: dqw018.) shows that the use of respirators reduces the maximum infection % by 1.5 times. The risk assessment model in combination with the developed computational methodology can determine the level of protection provided to the population in cases of health emergencies.

P4674 Space-time-resolved measurements of aerosol deposition in an idealized model of upper airways

M. Olivier Boiron1,2,3, M. Eric Bertrand1,3, M. Ira Katz4,5
1IRPHE CNRS UMR7342, Marseille, France. 2Ecole Centrale Marseille, Marseille, France. 3Aix-Marseille University, Marseille, France. 4Air Liquide Sante International, Paris, France. 5Dpt Mech. eng. Lafayette College, Easton PA, USA

Abstract

Introduction
Aerosol drug delivery is widely used for the treatment of lung diseases like COPD. This delivery method presents many advantages by increasing the efficiency of the local treatment and by lowering systemic effects. An important source of side effects observed consists in the deposition of the particles in the oropharyngeal airway geometry which are then swallowed [1]. Factors governing that deposition of particles include particle size and shape, influence of the geometry and carrier gas properties. Indeed, for patients with acute or chronic respiratory failure, oxygen transport to the alveoli may be significantly enhanced using gas with lower density than air. Practically it is mainly achieved by substituting nitrogen by helium (He-78:O2-22) leading to a reduction in the flow resistance and then a decrease in the work of breathing. Regarding aerosol transport, the change of the carrier gas from air to helium-oxygen has two main effects: increasing the tendency to laminar flow and reducing the Stokes number due to the viscosity of the helium mixture, the other parameters being fixed.

In this context, the aim of this study is to study experimentally the impact of helium-oxygen on the penetration of aerosolized medication into an idealized airway model.

Methods
Our model consists in a 90° bend in a pipe of square cross-section connected to a respiratory gas simulator. The model is made with transparent material making possible optical measurements by PIV to assess the velocity field in the mid plane of the bend. The aerosol deposition mass and area are evaluated by using an original fluorescence technique: rhodamine 6G-doped liquid aerosols are illuminated by a pulsed laser sheet. The fluorescence signal emitted by the aerosols is then acquired by an intensified camera. The calibration is achieved by comparison between fluorescence images and localized measurement of mass deposition using few small removable plugs introduced in the walls. Liquid aerosols are generated by a vibrating mesh nebulizer (MMAD 1µm-5µm [2]).

Results and discussion
For the breathing conditions examined, which corresponds to tachypnea (Remax=3700 and T=1.4s) we found very similar deposition patterns for air and helium-oxygen carrier gas. The deposition occurred mainly on the bend outer wall with a maximum at 20 degrees from the entrance section (inlet 0 degree, outlet 90 degrees). These results are in line with those of Breuer [3] obtained in a bend of circular cross-section. The value of the mass deposit is period independent but we observed a saturation effect after 50 cycles associated with the presence of a moving liquid film.

[1] Xi, J. et al., (2008), J. Biomedical Eng., 130, 3-16.
[2] Ari, A. et al., (2010), Respiratory care, 55, 837-44.
[3] Breuer, M. et al., (2006), Aerosol Sc., 37, 1407-1428.


14:20 - 14:40

O1819 Biomechanics of Cough Clearance

Dr. Peter Krumpe1,2, Cahit A. Evrensel3,4
1VA Medical Center, Reno, NV, USA. 2Professor emeritus, University of Nevada School of Medicine, Reno, NV, USA. 3Department of Mechanical Engineering, University of Nevada, Reno, Reno, NV, USA. 4Department of Biomedical Engineering, Ankara University, Ankara, Turkey

Abstract

Healthy people do not cough, therefore cough is a major symptom of respiratory illness. 

Expectoration of mucus by cough is a measure of cough's effectiveness.  We studied the displacement of  simulated mucus aliquot having controlled viscosity and elasticity during controlled coughs in a tracheal model.  Displacement was greater at higher cough velocity and with simulants having higher elasticity.  Altering the shape of the leading edge of the simulants by increasing the inclination of the model also facilitated greater mucus displacement.  These data can be extrapolated to predict ways to assist patients with respiratory illness cough effectively.

Children with asthma exacerbations have been demonstrated to express airway mucus with elevated gel-forming mucus (MUC5AC) than stable asthmatics and healthy controls (Welch et. Chest, 2017).  Furthermore the rheological properties of airway mucus from patients with cystic fibrosis also demonstrate increased viscoelasticity, both due to changes in elasticity of CF goblet cell  mucus and the presence of inflammatory leukocytes in their airways. The ability to cough effectively is degraded by increased elastic properties of airway mucus,

Chronic cough lasting >3 weeks is also a clinical criteria for significant lung disease.  Clinical assessment focuses on identifying associated post nasal drip, gastroesophageal reflux, smoking history or use of ACE inhibitors. Identifying and treating common pulmonary illnesses such as upper airway cough syndrome,  allergies, asthma, eosinophilic bronchitis, airway foreign body to name a few. Some of these patients may demonstrate  a persistent sense of the need to cough, the so called Cough Hypersensitivity Syndrome.   These conditions may remain refractory to disease-specific treatments and cough suppressants.  (Keller, et al., Chest, 2017). 

These many factors leading to effective cough and the ability of cough to facilitate clearance of airway mucus are challenges to clinicians and basic scientists alike.


14:40 - 15:00

O1820 Superimposed pressure oscillation therapy-acute and chronic asthmatic model responses

Professor Ahmed Al-Jumaily
Auckland University of Technology, Auckland, New Zealand

Abstract

Excessive airway narrowing due to airway smooth muscle (ASM) hyperconstriction is a major symptom in many respiratory diseases including asthma. Pharmaceutical treatments vary in their effectiveness from one subject to another, as do the side effects of long-term usage. Studies have shown that application of mechanical oscillations which are equivalent to the physiological patterns of normal breathing and deep inspirations in healthy airways can induce contracted ASM relaxation.  This type of response is not observed in asthmatics.

Acute and chronic murine asthmatic models were developed at our laboratory. Sensitization of animals using either ovalbumin, OVA (acute) or a DRA allergen mix (chronic) preceded measurements of key respiratory parameters.  Total lung resistance (RL) and dynamic compliance (Cdyn) were used as determinants of both the asthmatic state, and effectiveness of treatments.

Pulmonary responses of healthy, acute and chronic subjects were normalized against a standard respiratory constant.  Data values were analyzed relative to acetylcholine (ACh)-induced contractions.  Relaxations were also viewed in the context of values observed from isoproterenol (ISO) treatments.  Significant differences in the responses of acute and chronic subjects to the applied pressure oscillations (as well as control treatments) are noted.  The overall significance between acute and chronic asthmatic status is found in differential preferences of effective applied pressures.  Data indicates a potential for applying individualized SIPO treatments based on the state of the disease. This SIPO research presents novel findings which compare some of the respiratory processes of asthma, further elucidating the effects of medicinal and biomechanical targeting of the actinomyosin crossbridges as the site of action for ASM relaxation in asthmatic models.

15:00 - 15:10

O1821 Flow Instabilities in the Upper Airways During Phonation

Lukas Schickhofer, Dr. Mihai Mihaescu
KTH Royal Institute of Technology, Stockholm, Sweden

Abstract

Introduction
Speech is a crucial part of human communication and a complex, multi-stage process that entails fluid-structure-acoustics interactions in the upper airways. In this study, which is based on numerical flow simulations involving realistic geometries from magnetic resonance imaging (MRI) data, the impact of flow instabilities and near-field flow turbulence in the supra-glottal region on the spoken sound is investigated.

Methods
Direct aeroacoustic calculations are performed to resolve the full Fourier spectrum of frequencies relevant for both the phonation process and the unsteady glottal jet. The computation of the flow and pressure fields is accomplished by solving the compressible flow governing equations using a segregated approach. Turbulence is accounted for by using the large eddy simulation (LES) approach with a wall-adapting local eddy-viscosity (WALE) subgrid scale model. Regarding the discretisation methods, the convective flux is computed by spatial discretisation via a bounded central difference scheme. The integration in time is performed in an implicit manner and with a temporal discretisation of second order consisting of 10-15 inner iterations per time step [1]. The computational domain of the vocal tract is generated from MRI data of a healthy subject. A quasi-steady approach is considered with the shape of the glottal region being modified to account for different convergent-divergent shapes associated with the vocal folds during the phonation cycle.

Results
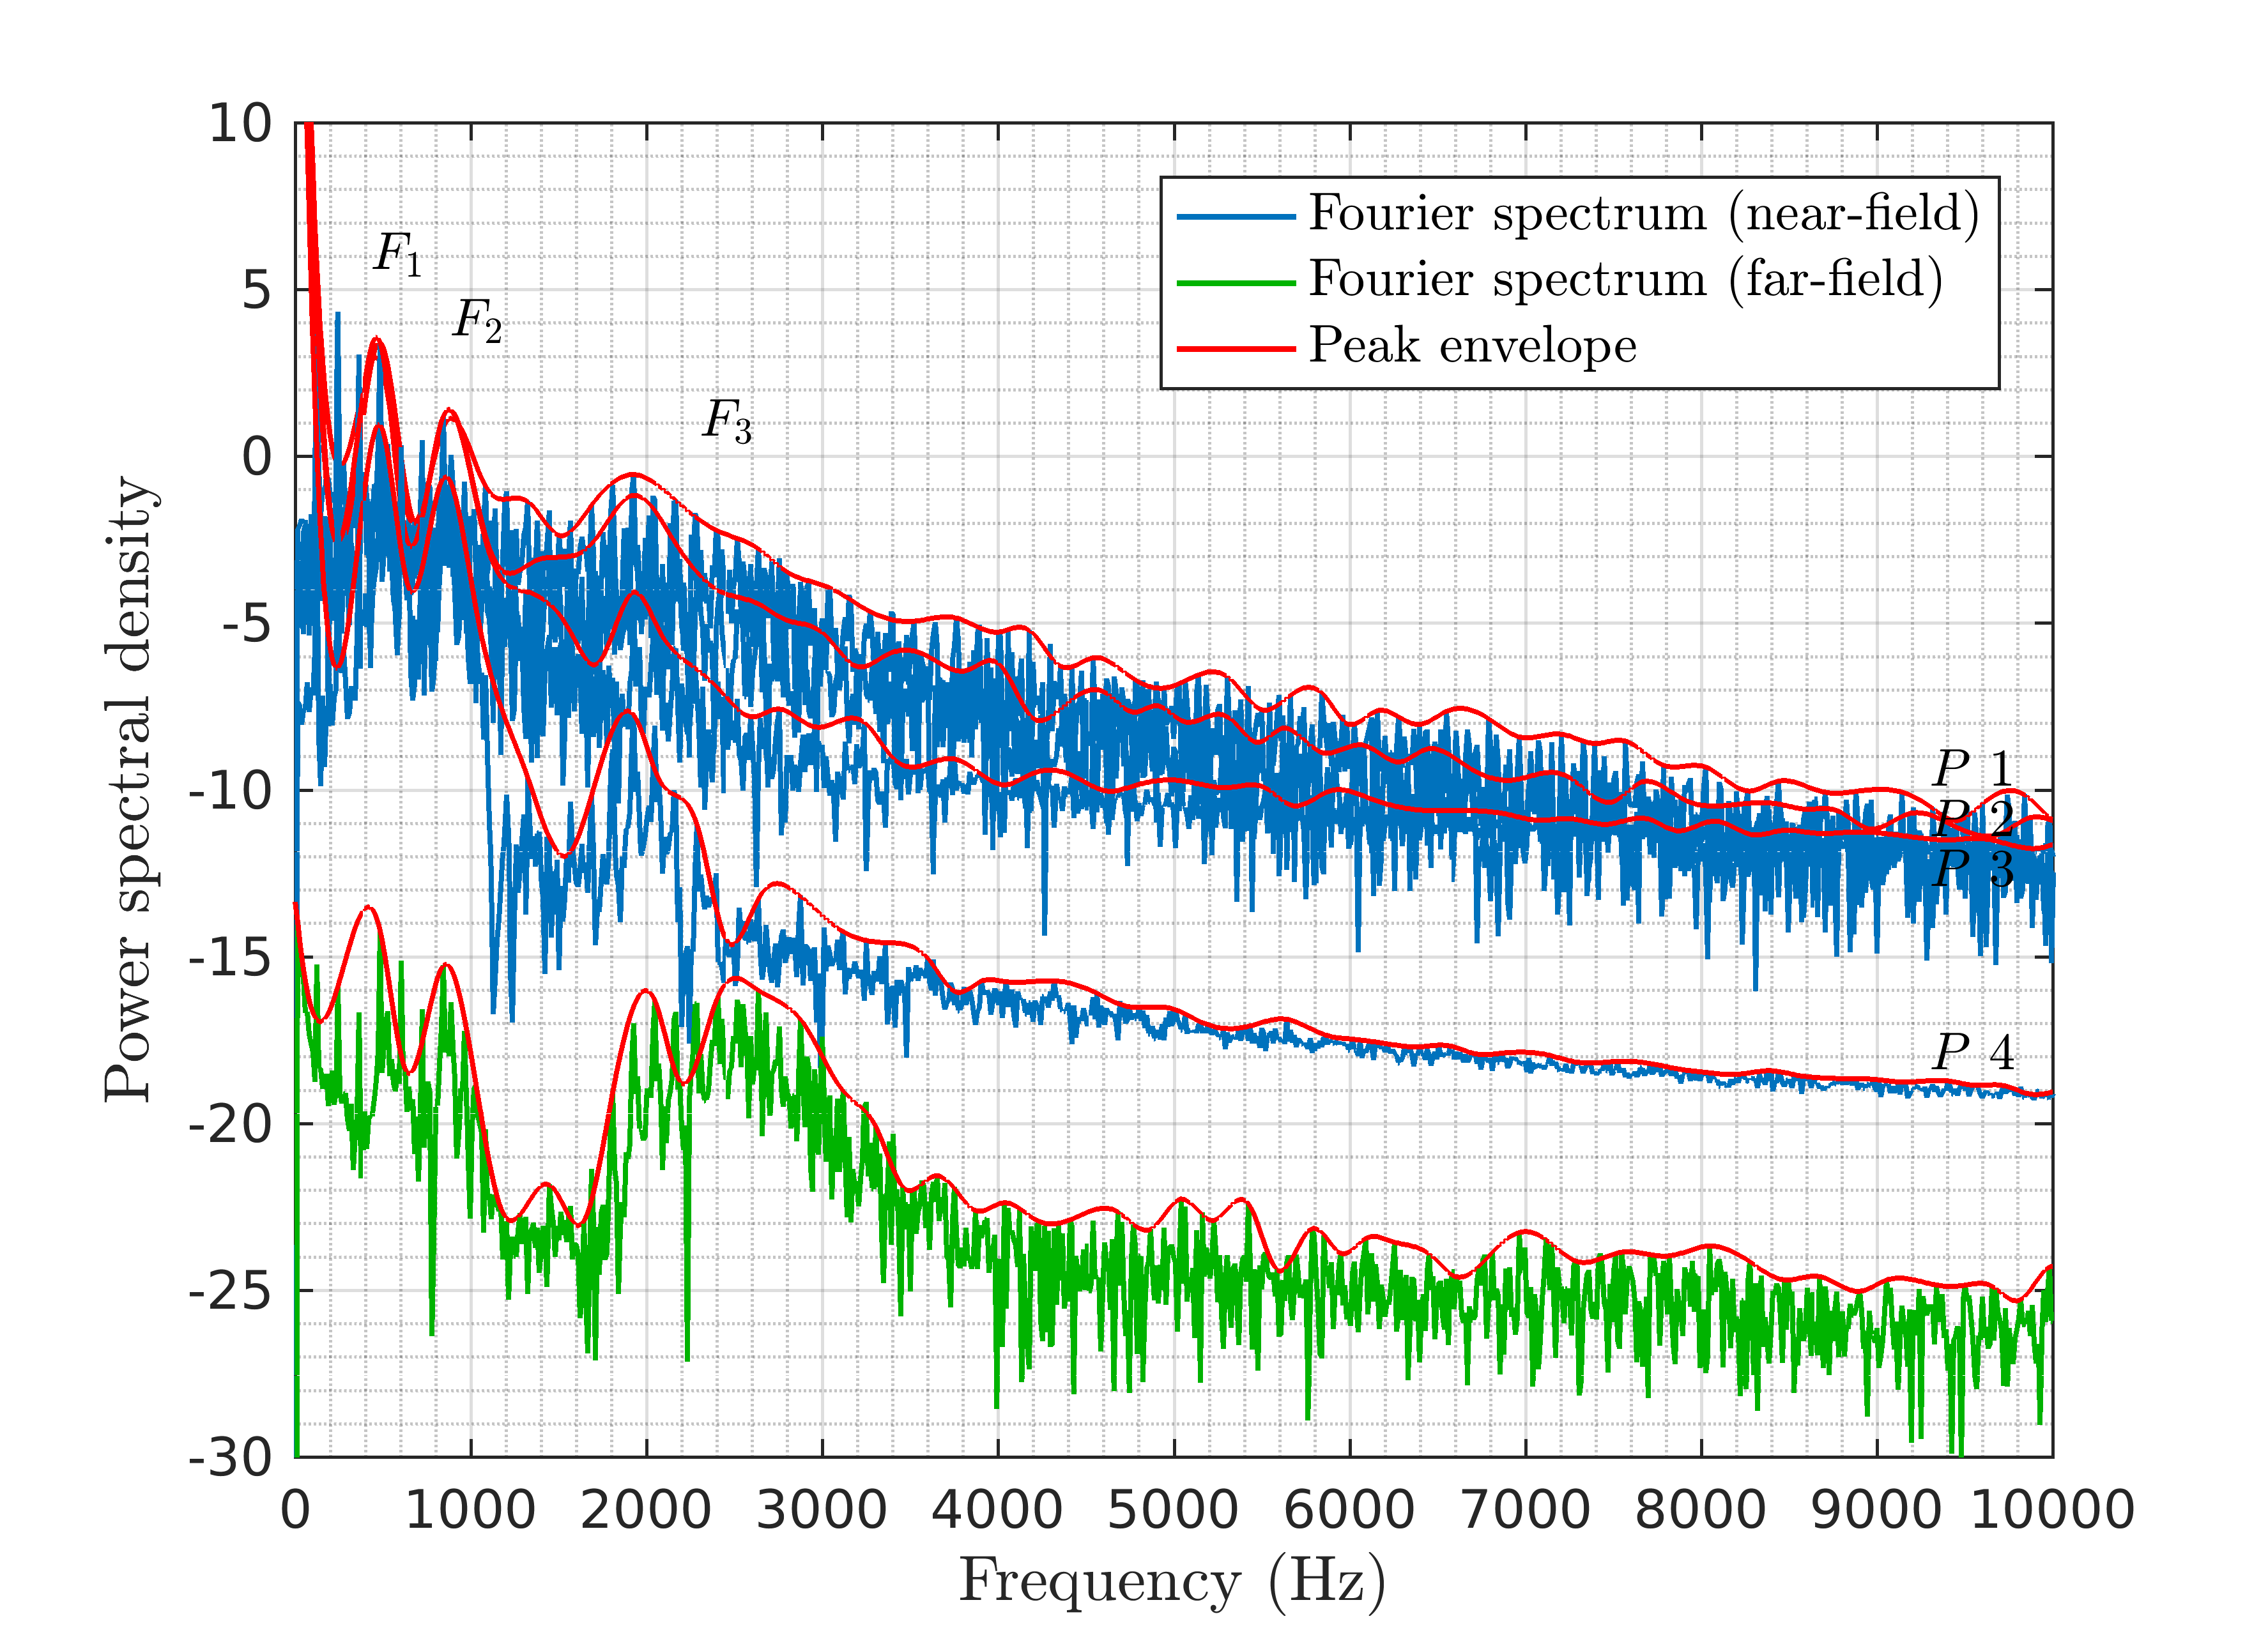
The dominant, energy-containing frequencies in the Fourier spectrum of the spoken sound are generated through amplification of pressure in the vocal tract. These formants are also recovered in Fig.1, which contains Hann-filtered data for the vowel [a]. It shows the spectrum of pressure fluctuation at probe positions inside and outside the airways. The broadband component at high frequencies is more prominent closer to the glottal jet and the supraglottal region, where turbulent flow and high vorticity is present due to high flow velocity gradients [2]. Additionally, certain frequencies such as F3 are established further downstream near the mouth outlet due to resonance effects. Cross-correlation data shows the connection between the aerodynamically generated fluctuation in the near-field and the acoustic pressure signal in the far-field.
Uncaptioned visual

Fig.1: Fourier spectrum of the acoustic pressure fluctuations in the far field and near field at increasing distance from the glottis (P 1, P 2, P 3, P 4) for the spoken vowel [a]. The approximate positions of formants F1, F2, and F3 are indicated.

Acknowledgements
This work is supported by the Swedish Research Council through the grant VR 621-2012-4256. MRI data has been extracted by the Speech Modelling Group at Aalto University, Finland.

References
[1]  L. Schickhofer et al. Springer Proceedings of ERCOFTAC DLES11, 2017.
[2]  M. Mihaescu et al. Journal of Acoustical Society of America, vol. 127, pp. 435-444, 2010.

15:10 - 15:20

O1822 Spatiotemporal organization of cilia drives multiscale mucus swirls in model human bronchial epithelium

Dr Etienne Loiseau1, Dr Delphine Gras2, Dr Pascal Chanez2, Dr Annie Viallat1
1Aix Marseille Univ, CNRS CINAM, Marseille, France. 2Aix Marseille Univ, CNRS, INSERM, LAI, Marseille, France

Abstract

Mucociliary clearance is a biomechanical mechanism of airway protection. It consists of the active transport along the bronchial tree of the mucus, a complex fluid propelled by the coordinated beating of a myriad of cilia on the epithelial surface of the respiratory tract. The physics of mucus transport is poorly understood because it involves complex phenomena such as long-range hydrodynamic interactions, active collective ciliary motion, and the complex rheology of mucus. The whole system is complexified due to the mechanical coupling between the cilia and the mucus, and due to its multiscale nature : from the micrometric scale of the active cilia, to the centimetric scale of the transport of mucus. A better understanding of the underlying physical mechanisms of mucociliary clearance would be of great interest in the context of severe chronic respiratory diseases which affect hundreds of million of people worldwide.

To tackle this intricate coupled active system, we adopt a multidisciplinary approach by combining experimental and in-silico studies. Our work merges three seemingly diverse, thriving research areas in biomedical inspired physical science : active matter, topological soft matter and cell biophysics. There is a burgeoning interest in studying complex self-organization and topological order at the tissue scale (1-3) to establish global physical principles which lead to generic biological behaviours.

Here we use a biomimetic system, an in-vitro reconstituted human bronchial epithelium, which captures the phenotype of in-vivo tissues such as ciliogenesis and continuous production of mucus. We present how microscopic active cilia self-organize and coordinate their beating in terms of directions and phases, to lead to the formation of deterministic and periodic fluid flow patterns, called mucus swirls, up to the centimetric scale (see Fig. 1). By considering the epithelium as a nematic material, i.e. which exhibits a long range orientational order, we present the spatiotemporal evolution of the nematic order during the ciliogenesis. Specifically we demonstrate how the mechanical coupling between the ciliated cells and the mucus drive the creation and annihilation of topological defects overtime and how this affect the efficiency of the mucus transport. Furthermore, we show that in absence of mucus the bronchial epithelium loses its orientational order. The creation or destruction of topological order and the resulting improvement/alteration of the mucus transport is of great interest in the context of wound healing and recovery from inflammation, which are both characteristic symptoms in severe chronic respiratory diseases. All these results are supported by numerical simulations which are essentials for a deep understanding of the fundamental physical principles which govern the emergence of fluid flow patterns.

Uncaptioned visual

References

1. Saw, T.B., et al., (2017), Nature, 544 p212

2. Kawaguchi, K., et al., (2017), Nature, 545 p327

3. Duclos, G., et al., (2017), Nature Physics, 13 p58

15:20 - 15:30

O1823 A new index for characterizing the efficiency of ciliary beating

Mathieu Bottier1, Sylvain Blanchon1,2, Emilie Bequignon1,3, Gabriel Pelle1, Daniel Isabey1, Pr André Coste1,4, Estelle Escudier5,6, Pr Jean-François Papon1,7,8, Pr James Grotberg9, Marcel Filoche1,10, Bruno Louis1
1INSERM U955 and CNRS ERL 7240, Créteil, France. 2CHU Toulouse, Hôpital des Enfants, Service de pneumologie allergologie pédiatrique, Toulouse, France. 3AP-HP, Hôpital H. Mondor-A. Chenevier, Service d'ORL et de chirurgie cervico-faciale, Créteil, France. 4Hôpital intercommunal, Service d'ORL et de chirurgie cervico-faciale, Créteil, France. 5INSERM U933 and Université Pierre et Marie Curie, Paris, France. 6AP-HP, Hôpital Armand-Trousseau, Service de génétique et d'embryologie médicale, Paris, France. 7-HP, Hôpital Bicêtre, Service d'ORL et de chirurgie cervico-faciale, Le Kremlin-Bicêtre, France. 8Faculté de Médecine, Université Paris-Sud, Le Kremlin-Bicêtre, France. 9Department of Biomedical Engineering, University of Michigan, Ann Arbor, USA. 10Physique de la Matière Condensée, Ecole Polytechnique, CNRS, Université Paris-Saclay, Palaiseau, France

Abstract

Mucociliary clearance is one of the major line of defense in the airways. It ensures the transport of unwanted particles towards the pharynx where they are swallowed. The mucus layer which traps these particles is carried away along the airway tree by the constant beating of the cilia covering the epithelial cells. The mucociliary clearance efficiency results from the interplay between the mucus characteristics and the cilia beating which is characterized by two main features: (i) a highly complex motion of the individual cilia, with an asymmetric beat pattern, and (ii) a highly coordinated motion amongst a large number of individual cilia (metachronal wave) contributing to optimize the propulsion effort.

Various human disorders are related to ciliary dysfunction. In clinical practice, ciliary beating is evaluated ex vivo under light microscopy by observation of ciliated edges that are obtained by nasal or bronchial brushing. The ciliated edges are suspended in a survival medium whose thermodynamic properties are close to water. This analysis provides a quantification1 of the cilia motion or a qualitative description2 of the beat pattern, but do not supply information on the global efficiency of ciliary beating.

In order to assess this global efficiency we have developed a method of micro-bead tracking coupled to a mathematical model simulating the flow generated by the cilia beating in the survival medium. The micro-beads act as markers of the flow generated by the cilia allowing visualization and quantification of the fluid velocity around the ciliated edge3. The mathematical model4 describes the momentum transfer from discrete cilia to the survival medium through a continuous boundary condition (in which cilia tips are seen as a moving cilia wall) whose characteristics are frequency, amplitude, wavelength and slip length. The slip length accounts for a partial momentum transfer between the cilia wall and the fluid due to a non continuous coverage of the cilia.

This model predicts that the steady contribution to the flow field exhibits a parabolic profile away from the ciliated edge, in very good agreement with experimental results (Fig1).

Fig1.png

Finally, we propose the shear stress exerted by the cilia wall on the fluid as a global index of the ciliary beating efficiency. This shear stress is easily deducible from micro-bead tracking experiments without requiring any modification of the present clinical practice of data collection (nasal or bronchial brushing). It has the potential to become of very powerful evaluation tool for pathologies such as primary ciliary dyskinesia.

1: Papon et al. Orphanet J Rare Dis. 2012; 7:78.

2: Jackson et al. Eur Respir J. 2016; 47:837-848.

3: Bottier et al. PLoS Comput Biol. 2017 Jul 14;13(7) e1005605

4: Bottier et al. PLoS Comput Biol. 2017 Jul 14;13(7) e1005552

15:30 - 15:40

O1824 Enhancing mucus clearance by cough through repeated pulses

Duygu L. Tuna1,2, Altay Ünal3, Fikret Arı4, Peter Krumpe5,6, Cahit A. Evrensel7,8
1Department of Physics, College of Science, Ankara University, Ankara, Turkey. 2Physics Group, College of Engineering, Atılım University, Ankara, Turkey. 3Department Physics Engineering, College of Engineering, Ankara, Turkey. 4Department of Electrical and Electronics Engineering, College of Engineering, Ankara, Turkey. 5VA Medical Center, Reno, NV, USA. 6University of Nevada School of Medicine, Reno, NV, USA. 7Department of Biomedical Engineering, College of Engineering, Ankara University, Ankara, Turkey. 8Department of Mechanical Engineering, College of Engineering, University of Nevada, Reno, NV, USA

Abstract

Introduction:

Rheological properties of the mucus change in patients with lung diseases such as Chronic Obstructive Pulmonary Disease (COPD), Cystic Fibrosis (CF) and Bronchiectasis  (Rubin, 2010). When the ciliary mechanism is not sufficient to maintain clearance because of the hypersecretion of the mucus, change in its rheology, cough mechanism has a critical role (King et al., 1983). The main focus of this study is to investigate the potential increase in effectiveness of the cough clearability by repeated pulses of the same maximum speed and total air volume compared to single pulse.

Methods:

Experiments are conducted to study the behavior and clearance of the mucus simulant through a D-shaped rigid Plexiglas horizontal tracheal model by approximately rectangular pulses. Mucus simulant with viscoelastic properties similar to patients with COPD or similar illnesses, moderate increase in elastic modulus and sharp decrease in viscosity with increasing frequency, was prepared by locust bean gum and borax using the procedure  described by Ragavan et al (2010) for the simulant referred to as “12-mL” in their study. Displacement of 0.3 ml mucus simulant aliquot is measured during single or repeated air flow pulses with total air volume of 1.1 liter and the same maximum velocity.  Desired flow pattern is generated by a compressor set at 6 bar and computer controlled on-off valve.  The displacement of the mucus aliquot is estimated by measuring the motion of the approximate mass center during simulated cough.

Results:

The results for displacement vs number of pulses and flow pattern of pulses are shown in Figure 1.  Displacement of the same volume of mucus aliquot increases with the increasing number of pulses with the same total volume of air and maximum velocity.   


Uncaptioned visual

Fig.1: The effect of increasing pulse number on the displacement of mucus aliquot at artificial trachea.

Discussion:

This experimental study suggests that coughing the same volume of air with short interruptions rather than as single cough increases its clearing efficiency by increasing the total displacement travelled by mucus aliquot.  One may also argue that similarly the same procedure may reduce the cough velocity needed to start moving the mucus aliquot.     

Acknowledgement:

This study is funded by European Union through 2236 Co-Funded Brain Circulation Scheme.

References:

  1. Ragavan, A. J., Evrensel, C. A., & Krumpe, P. (2010). Interactions of airflow oscillation, tracheal inclination, and mucus elasticity significantly improve simulated cough clearance. Chest, 137(2), 355–361. https://doi.org/10.1378/chest.08-2096
  2. 2. Rubin, B. K. (2010). The role of mucus in cough research. Lung, 188(SUPPL.), 980646. https://doi.org/10.1007/s00408-009-9198-7
  3. King, M., Phillips, D. M., Gross, D., Vartian, V., Chang, H. K., & Zidulka, A. (1983). Enhanced tracheal mucus clearance with high frequency chest wall compression. The American Review of Respiratory Disease, 128(3), 511–515.