Introduction: Home-based exercises are often prescribed by doctors and physiotherapists to older adults living in the community for fall prevention. However, poor adherence with the exercise is a huge challenge and can compromise the effectiveness of the prescribed exercises1. Hence, this study aims to evaluate whether an interactive smartphone application (app) could engage older people to exercise at home and explore their experience in using the app. The interactive app (Nymbl) used in this study has features including animated instructions guiding the exercises, quiz, increased exercise difficulty automatically based on the users’ progress, self-monitoring exercise progress and exercise reminder. Those are designed to motivate participants and facilitate changes in behaviour.
Methods: Seventeen older adults living in the community (mean [SD]: 67.7 [6.7] years old; 5 males) underwent a home-based balance exercise programme for at least 21 days using the Nymbl app. Their balance was assessed prior to and following the exercise using a Nymbl evaluation app. A balance index (BI) between 1 and 100 was provided by the app to indicate how well their balance is, with 100 meaning excellent balance. Exercise adherence was assessed based on the completion of the programme recorded by the app. At completion, participants were given a questionnaire regarding their experience of the exercise programme (score 0 to 10, with 10 indicating very much so). Semi-structural focus groups were conducted to further explore participants’ perception and experience of using the smartphone app for the home-based exercise.
Results: The exercise adherence was 82.70% [15.01], and their BI significantly improved (~14% greater than the initial BI) after the exercise programme (p<0.05). Results of the questionnaire showed that participants felt benefits from the exercise programme (7.7 [2.3]) and found it easy to fit in to their daily routine (7.5 [1.9]). They were happy about the given BI prior (8.8 [2.5]) to and following (7.6 [2.2]) the programme. Participants mostly enjoyed the animation for demonstration of the exercise (72.7%), followed by clear and helpful instructions (64%). Further, analysis of the focus groups resulted in 4 categories: (i) practical issues; (ii) participants’ experience; (iii) utility; and (iv) app development. The results show that receiving appropriate communication and support from the app developers were helpful in the acceptance process to reduce technological barriers. Additionally, participants agreed that self-assessment throughout the programme would improve engagement in the exercise.
Discussion: This study demonstrates the willingness of older adults living in the community to use smartphone apps as a potential solution to improve engagement in home exercise. Future development and testing of the effectiveness of the smartphone app in comparison with standard care should be considered.
Acknowledgements: Thanks to Nymbl Science for providing the app.
References: Jack et al. DOI:10.1016/j.math.2009.12.004.
Maintaining an optimal stability (OS) serves as a primary criterion for self-optimization of human locomotion [1], a process whereby adaptations in biomechanics and physiology coincide. It has been suggested that wearable trunk accelerometry (WTA) could be used as an in-field tool to evaluate OS while running [2], yet this theory currently remains untested. Here, we hypothesized that WTA stability measures could be used to evaluate if runners have an OS, and if so, whether OS would be linked to physiological manifestations of fatigue.
MethodsRecreational runners (n=22) participated in a discontinuous incremental running protocol on a motorized treadmill (4min stages; 1min rest periods; starting at 8 or 9km.hr-1; 1.5km.hr-1 speed increments; 1% gradient). Blood lactate was collected before every speed increment using a portable lactate analyzer (LactatePro2, Japan), and onset of blood lactate (OBLA) was defined as >4mmol.L-1. Tri-axial (vertical, mediolateral, anteroposterior) acceleration root mean square (RMS) measures were extracted from gravity-corrected trunk accelerations (Shimmer3, ±16g range, 1024Hz, Ireland). Each axis RMS was normalized to the resultant RMS vector to represent the proportion of acceleration occurring in each axis (i.e., RMS ratio), and calculated over non-overlapping moving average of 10seconds during the entire running protocol (MATLAB 2017b, USA). Linear and quadratic fits were assessed for each RMS ratio using goodness of fit (R2), and comparisons between models were done using paired t-tests. Additionally, paired t-tests and Pearson’s correlations were performed between the time (min) of OS and OBLA.
ResultsOS was identified in all runners using the vertical RMS ratio and thus this measure was used for further analysis (e.g. Fig1). Fitting a curvilinear (quadratic) model to vertical RMS ratio consistently produced significantly higher R2 values than fitting a linear model (mean R2 0.63 and 0.93 for linear and quadratic fits; p<0.01). Time of OS occurred significantly earlier than OBLA (5.9±2.9 min versus 15.8±4.2 min; p<0.05) and was not correlated (r=0.05).
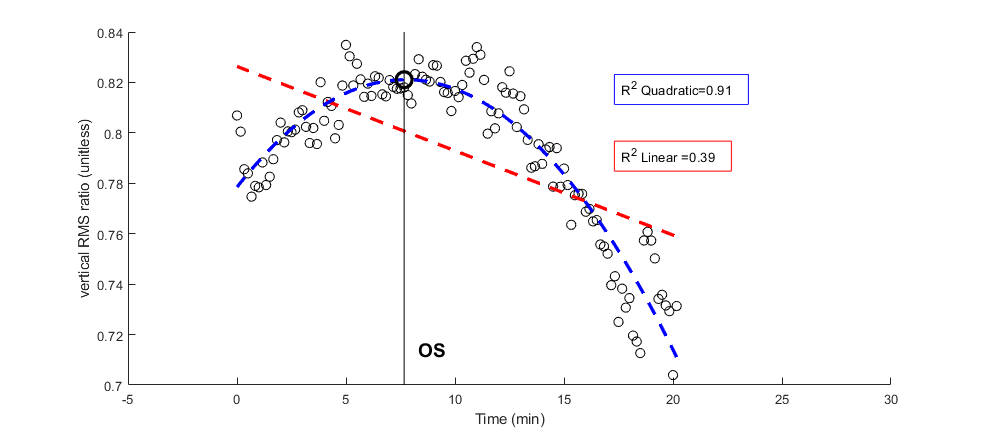
Fig.1: Comparison of linear and quadratic goodness of fit for one representative runner using vertical RMS ratio. Optimal stability optimum (OS) occurred at 7.7min.
DiscussionOur first hypothesis was supported in that runners demonstrated an OS using the RMS ratio measure of vertical trunk accelerations. In contrast to previous research [3], our data suggest that runners self-optimize their stability, possibly due to a combination of preferred speed and fatigue. However, our second hypothesis was refuted since OS was not related to OBLA, indicating that other manifestations of fatigue (e.g., ventilatory threshold) warrant further investigation.
References1. Holt KG, et al., J Mot Behav. 1995;27: 164–78.
2. Schütte KH, et al., J Appl Physiol. 2017; 3–6.
3. McGregor SJ, et al., PLoS One. 2009;4: e7355.
Introduction
The necessity of monitoring motor development beyond infancy has been widely recognized, given the overall decline in children’s skill performance and the relevant incidence of mild motor impairments, often not timely diagnosed [1]. Despite natural gait (NW) is considered the gold-standard task for locomotor assessment [2], its specificity as a paradigmatic task does not allow investigating how a child deals with new, more challenging motor experience. Tandem walking (TW) is often used in clinics to highlight motor impairments in children [3]. Human movement analysis methods (e.g. inertial sensors) can support the widespread assessment of these tasks, providing objective, quantitative descriptors of locomotion maturation. Parameters related to performance rhythmicity, complexity and variability can be quantified and can highlight deviation from typical development [4]. This work aims at introducing a graphical representation for the quantitative monitoring of motor development from childhood to adulthood, offering innovative assessment, reference bands and facilitating results interpretation.
Methods
112 typically developing subjects participated in the study. Groups were organized per age: 6-, 7-, 8-, 9-, 10-year-old children, 15-year-old adolescents and 25-year-old adults. Acceleration and angular velocities of trunk and shanks were collected using three tri-axial inertial sensors (Opal, Apdm), while participants walked in NW and in TW at self-selected speed. For each participant 14 strides were analyzed. Stride, Stance, Double support (DS) duration, standard deviation and Poicarré plots of stride-time (stdStride, SD1 and SD2) were obtained from shank angular velocities [4]. Fundamental frequency (associated to cadence) (ff), Harmonic Ratio (HR), Sample Entropy (SEN) and Recurrence Quantification Analysis (recurrence rate, RR, and averaged diagonal line length, AvgL) were calculated on trunk acceleration components [4]. Parameters showing task/age effect (Kruskal-Wallis test, significance level 5%) were represented on a polar plot. After being normalized with respect to minimum and maximum of available data, parameters were positioned in sectors representing different areas of motor control performance. Reference bands (mean ± standard deviation) for each age-group were defined.
Results
Figure1 shows exemplificative reference bands for 6year-old children (light grey) and 25year-old adults (dark grey). Sectors represent motor complexity (A), postural control ability (B), temporal parameters (C) and variability (D).
Discussion
Defined polar plots allow evaluating locomotor changes with maturation at first glance. The patterns in NW and TW can be considered ‘Fingerprints’ of locomotor maturation, allowing assessing in which area changes happen and towards which direction, depending on the task. With the inclusion of a higher number of data, this tool has the potential to be used for screening and monitoring locomotor performance in developing population.
References
[1] Cairney J, University of Toronto Press, 2015
[2] Perry J, Burnifield JM, Slack Incorporated, 2010
[3] Goddard-Blythe S, Wiley-Blackwell, 2014
[4] Bisi MC, Stagni R, Biomed Eng Online, 2016
Introduction
Recent developments in sensor technology have made remote gait analysis using Inertial Measurement Units (IMUs) with accelerometers and gyroscopes feasible and affordable. A variety of techniques have been used to obtain accurate gait parameters1. The present work validates a methodology, from calibration to integration algorithms, for determining gait parameters in daily activities with clinical level accuracy and applications to pathological gait.
Methods
Two experiments were performed. In each, step-by-step gait parameters determined from 6 DOF IMUs were compared with data collected via a 10 camera Vicon motion capture system.
Experiment 1, five subjects walked and ran on a level treadmill and walked on an inclined treadmill with a custom ankle foot orthosis (AFO) containing an IMU (Freescale MMA7331LC accelerometer and a biaxial Invensense IDG-640 uniaxial ISZ-650 gyroscopes) in the foot instep. Over 1250 strides were analyzed.
Experiment 2, five healthy subjects wore a smaller IMU (built around an Adafruit LSM9DS1 board) in the shoe sole. Subjects walked on a treadmill at their comfortable speed, slower and faster, and with variable step lengths. Over 950 strides were analyzed.
In both experiments the same calibration2, frequency analysis, event detection, and direct integration methods with zero velocity updates were used to transform accelerometer and gyroscope signals to stride-by-stride gait metrics, although the experiments used different IMUs, both developed by UVA Wireless Health Center.
Results
Both experiments successfully identified nearly 100% of relevant gait events (Fig. 1) using gyroscope data. Experiment 1 found small RMSEs in gait speed of 1.8%, 3.6%, and 2.2% for level walking, incline walking and level running, respectively. There was an average RMSE of 27 ms in the length of the gait cycle. This resulted in RMSEs in stride length of 7.3%, 8.8% and 5.2% respectively. For Experiment 2, the RMSEs of gait speed on the treadmill for slow, comfortable, fast walking, and deliberately varied step length were 1.60%, 2.59%, 3.82%, and 3.22%, respectively. The errors of stride length were improved at 2.9 and 3.9% for comfortable and fast walking respectively.
Discussion
These results reveal that out-of-lab gait measurements can be made with clinical level accuracy. The accuracy found in Experiment 2 is near the best results reported in the literature3. In addition, these are the first results that apply algorithms for level and inclined walking, as well as running without assumptions about the individual’s gait. The generality of the methodology is shown in that good results were obtained with both IMUs, as well as with the altered gait patterns of AFO’s.
Acknowledgements
NSF Grants #1034071 and 7476090.
References
1. Chen et al., (2016) IEEE J. Bio. H. INFOR, 20 (6), 1521-37
2. Simpson, et al., (2014) WCB.
3. Trojaniello, et al. (2014) JNER, 11:152.
Introduction: Instrumented gait assessment after ankle fracture has not been widely investigated, with only a few studies showing a partial recovery after surgery1,2. Antigravity treadmills allow early gait rehabilitation by reducing body weight and could improve post-surgery outcomes. The aims of this study were to: (i) test the feasibility of using IMUs to quantify gait on an antigravity treadmill of a patient post bimalleolar ankle fracture surgery and (ii) quantify changes in gait parameters depending on changes of treadmill speed and bodyweight.
Methods: A 52 years-old endurance runner and biker was recruited 3 months after surgery. Gait assessment was performed on the antigravity treadmill using IMUs: one positioned on the lower back and two on tibias. Eight two-minute walking trials were performed: four at self-selected speed with body weight at 100%, 90%, 70% and 50% respectively and four at maximal speed.
Stride time and Absolute Symmetry Index (ASI) were evaluated using Initial Contact (IC) and tibial Initial Peak Accelerations (IPA)3,4; between-limbs differences were evaluated with parametric or non-parametric t-tests depending on normality of data.
After the baseline assessment, raw IPA of the affected limb were visualised in real time on a screen by the patient and were used as biofeedback during a thirteen-minute gait retraining trial: the subject was asked to walk by keeping raw IPA values in the reference range (18-20 m/s2).
Results: Signals were not affected by the presence of the antigravity treadmill: no data were lost. Foot Initial Contact in all conditions and IPA also were correctly identified. At baseline no significant difference was found for stride time between limbs (1.12±0.02s, p>0.683). Mean values of IPA of the unaffected limb were always significantly higher than the affected (p<0.001). ASI worsened progressively at bodyweight reductions (Figure 1). During the retraining session the subject was able to significantly increase IPA values of the affected limb respect to baseline (p<0.001) and reduce ASI.
Discussion: It was feasible to use IMUs for quantify gait on an antigravity treadmill in a subject after bimalleolar ankle fracture surgery; ICs and IPAs were clearly detectable in all trials. The set-up and assessment lasted for about 1 hour which is an acceptable time for a clinical setting. Despite stride time of each limb resulted equal in all eight trials, we found that the unaffected limb was much more loaded in all trials (higher IPA). ASI and IPA seem valuable outcomes for gait assessment and retraining sessions and could be used as biofeedback for gait rehabilitation strategies.
References:
Introduction
Age-related spinal deformity affects roughly 68% of individuals over the age of 70, often leading to severe disability[1]. Changes in spinal alignment lead to alterations in posture and muscle recruitment, resulting in musculoskeletal compensation strategies. While these compensatory mechanisms can be captured in dedicated biomechanical labs using motion capture, inter- and intra- subject variation, and the technical and financial barriers to deploy these systems clinically present challenges to integrate patient-specific biomechanics into clinical decision-making. This current study investigates the potential of using a recently developed depth camera system to track patient motion in clinic, relating kinematic and kinetic metrics to patient outcomes.
Methods
Six non-clinical subjects (5M,1F, 1.82±0.06m, 68.8±9.2kg) and five subjects scheduled for spinal fusion (1M,4F, 1.66±0.07m, 58.5±11.3kg) were recruited under informed consent (UCSF IRB #17-22291). A single Kinect 2 depth camera was used to track key body landmarks. Both cohorts performed repeated sit-to-stand actions, with a target of nine complete repetitions or until fatigued. Raw estimates of joint position were filtered using a height, mass, and sex scaled rigid body model, providing constraints on the recovered joint angles and limb lengths [2].
Discussion
Trunk inclination (TI) captures the sagittal angle of the torso as a subject actively rises from an upright stable seated position to an upright stable standing position. TI is the angle between a line connecting the mid-shoulder and mid-hip joint positions and vertical plane. The Maximum TI Angle (MTIA) for both cohorts is shown in Figure 1. The estimated distribution for the non-clinical population was used as an asymptomatic baseline for all clinical subjects. Pre-surgery, subjects were found to have a higher MTIA than the non-clinical group. An exception is one subject (denoted by a red cross), who stood by sliding forward on the chair before standing, showing a lower MTIA than the non-clinical group. Six weeks post-surgery, TI during the sit-to-stand manoeuvre was found to be closer to the non-clinical population. A single post-surgical subject (represented by blue circles) who was experiencing pain, and scheduled for revision surgery was found to have a high MTIA, similar to the pre-surgical individuals.
These data demonstrate that patient-specific biomechanics can be collected in the clinic setting, and may be valuable to discriminate movement biomarkers that can inform clinical care decisions.
Acknowledgements
NIH:STTR #1R41AR068202-01A1
References
[1] Schwab, F. et al. (2005). Spine. 30 (9) p1082-1085
[2] Chaffin D.B. et al. (1999) Occupational biomechanics
Figure 1: Longitudinal tracking of MTIA, pre- and post- spinal fusion. Mean and standard deviation at each session are plotted for each subject. Mean (and standard deviation) for the non-clinical population is shown as the horizontal solid (and dashed) lines.
Introduction
Three-dimensional knee rotations can serve as indicators of human performance and joint health. They are traditionally measured using optical motion capture systems, which restrict studies to a laboratory setting. Inertial measurement units (IMUs) provide an alternative means to measuring knee rotations due their unconstrained capture volumes and noninvasive nature. With the proper techniques for accounting for drift inherent to utilizing IMUs, rotations are estimated from IMUs fastened to the thigh and shank by relating their orientations to a common world frame. The purpose of this study is to validate a method of computing three-dimensional knee rotations on human subjects during a range of tasks.
Methods
Subjects were outfitted with a full body motion capture marker set and IMUs (Opal sensors, APDM, Portland OR) rigidly attached to shanks and thighs via elastic straps. IMU orientations are resolved into world frames defined using magnetic north and gravity. A kinematic constraint can resolve differences in the world frames due to variations in the magnetic field provided by the shank- and thigh-mounted IMUs (methodology described in [1]). Three subjects performed a set of functional alignment movements to define the thigh and shank anatomical frames of reference relative to the sensor frames. They then performed a range of tasks of increasing dynamics including step-ups, stationary bicycle riding, drop boxes, and jump cuts.
Results
Several previous studies found systematic differences in anatomical angles (flexion-extension, internal-external rotation, abduction-adduction) that likely derive from discrepancies between the ISB (position-based) convention for defining anatomical frames of reference and IMU (kinematic-based) methods like the ones used in this study. Therefore, we decompose the rotation matrices describing the thigh anatomical frame relative to the shank anatomical frame into an axis-angle representation. The angle (Figure 1) represents the total rotation across the knee, which should be the same regardless of how the anatomical frames are defined.
Figure 1: Sample time series of a subject riding on a stationary bike during a testing session.
Discussion
The goal of this study is to validate the methodology documented in [1] with human subjects, which was slightly modified to account for the added complexity of the human knee. The differences could be due to the world frame correction being too aggressive, meaning internal-external rotation and abduction-adduction rotations were removed as part of the world frame drift, or motion capture marker skin artifacts could be registering additional (artificial) rotations across the joint. Nonetheless, the results hold promise especially given that the IMU data were integrated over more than an hour of data.
Acknowledgements
This material is based upon work supported by the US Army Contracting Command-APG, Natick Contracting Division, Natick, MA, under contract W911QY-15-C-0053.
References
Introduction
The Star Excursion Balance Test (SEBT) is a dynamic test that can be used to predict and assess musculoskeletal injuries [1]. Accurate assessment of body movement during the test requires a motion capture system, limiting the number of clinicians who have access to the necessary equipment. This study aims at evaluating the accuracy of a portable and inexpensive device, such as Microsoft’s Kinect® One Motion Sensor, for analyzing SEBT.
Methods
Ten subjects participated in the study. Their motion was simultaneously recorded by Microsoft’s Kinect® One and VICON motion capture system (gold standard). The SEBT consisted in stretching a leg as far as able just above the ground without touching it and then retract, while maintaining balance on the other leg (figure 1). This was performed in 8 directions, starting anterior to the subject and continuing clockwise at 45-degree intervals. For each direction, the maximum excursion was computed and the relative error between Kinect®’s measurement and that of VICON was determined. Confidence intervals for the errors in the eight directions were calculated.
Results
Errors in anterior, anterior lateral and anterior medial directions were found to be unbiased (confidence interval passing through 0) and less than 7%. Larger errors were found in the other directions (Table).
Direction | 95% confidence interval of the error |
---|---|
Anterior | -0.6% - 5.6% |
Anterolateral | -4.5% - 0.5% |
Lateral | 2% - 6.6% |
Posterolateral | 4.4% - 12.8% |
Posterior | 8.8% - 18.9% |
Posteromedial | 20.2% - 27.5% |
Medial | 15% - 25.8% |
Anteromedial | -4.7% - 7.5% |
Discussion
The accuracy of the Kinect is related to the angle at which it captures the movement: when the movements are directed towards the camera and are unobstructed (excursion in anterior, anterolateral and anteromedial directions), the accuracy is the highest; when the movements are directed away from the camera and are obstructed by the body, the error is larger and biased. Further research should be performed to determine whether the accuracy of the Kinect® sensor can be improved by positioning the camera behind the subject when performing movements in the posterior, posterolateral or posteromedial directions.
References
[1] Gribble, P.A., Hertel, J. and Plisky, P., 2012. Using the Star Excursion Balance Test to assess dynamic postural-control deficits and outcomes in lower extremity injury: a literature and systematic review. Journal of athletic training, 47(3), pp.339-357.
ABSTRACT
Background
Wearable sensors offer the potential to bring new knowledge to inform interventions in patients affected by Multiple Sclerosis (MS) by thoroughly quantifying gait characteristics and gait deficits from prolonged daily living measurements [1,2]. The aim of this study was to characterise gait for a group of patients with moderate to severe ambulatory impairment due to MS by investigating walking bouts (WBs) extracted from both daily life and laboratory wearable inertial sensors data.
Methods
Fourteen patients with MS divided in two groups according to their disability level (EDSS 6.5-6.0 and EDSS 5.5-5.0, respectively). They performed both intermittent and continuous walking bouts (WBs) in a gait laboratory wearing waist and shank mounted inertial sensors. An algorithm (A1, [3]) to estimate gait events and temporal parameters (mean and variability values) using data recorded from the waist mounted sensor (Dynaport, Mc Roberts) was tested against a reference algorithm (A2, [4]) based on the shank-worn sensors (OPAL, APDM). Subsequently, the accuracy of another proprietary algorithm (A3) to detect and classify WBs was also tested. The validated algorithms were then used to quantify gait characteristics during short (sWB, 5-50 steps), intermediate (iWB, 51-100 steps) and long (lWB, >100 steps) daily living WBs and laboratory walking. Group means were compared using a two-way ANOVA.
Results
A1 compared to A2 showed good gait event accuracy (0.05 – 0.10 s absolute error), and was not influenced by disability level. It slightly overestimated stride time in intermittent walking (0.012 s), and overestimated highly variability of temporal parameters in both intermittent (17.5% – 58.2%) and continuous walking (11.2% – 76.7%). The accuracy of A3 was speed-dependent and decreased with increasing disability.
The ANOVA analysis showed that patients walked at a slower pace in daily living than in the laboratory. In daily living gait, all mean temporal parameters decreased as the WB duration increased (Table 1). In the sWB, the patients with a lower disability score showed, on average, lower values of the temporal parameters. Variability decreased as the WB duration increased.
Conclusions
This study validated a method to quantify walking in real life in people with MS and showed how gait characteristics estimated from short walking bouts during daily living may be the most informative to quantify level of disability and effects of interventions in patients moderately affected by MS. The study provides a robust approach for the quantification of recognised clinically relevant outcomes and an innovative perspective in the study of real life walking.
References
[1] Motl RW et al. Disabil Health J. 2011;4:52–7.
[2] Sandroff BM et al. J Neurol Sci. 2014;340(1–2):50–7.
[3] McCamley J et al. Gait Posture. 2012;36(2):316–8.
[4] Trojaniello D et al. J Neuroeng Rehabil. 2014;11(1):152.
Introduction.
Many types of sensors are used in exoskeleton robots as an input device and among them, the sole pressure sensor is one of the most commonly used ones. But most of the calculation algorithm is designed only in a flat and rigid environment. And, it cannot be said that the situation will be flat all the time for exoskeleton robots. Therefore, in a tilted environment, the pressure distribution data on the soles of the robot cannot accurately derive the gait cycle or operate as an accurate input device. In this paper, a special algorithm and foot sensor are designed to solve this problem.
Method & Result.
First, we collect data of foot pressure distribution during walking with teckscan's product Footscan. Based on this pressure data and anatomical structure of the human body, we select eight major pressure points at toe, metatarsals, foot side, and heel, to represent foot pressure distribution.
Then, we design an algorithm to fabricate the initial total pressure distribution surface data from these eight major pressure points. After designing the algorithm, we make and test the actual footwear. A pressure sensor sole is made by mounting 8 A201 film type pressure sensors from Tekscan at the main 8 pressure points between two memory foam insoles. This insole and the Footscan are put together and we receive the data simultaneously to improve the algorithm with it. Through this algorithm, we can obtain the whole pressure distribution across the foot with only eight pressure sensors. We can also find the pressure center, and walking phase by tracking the movement of the pressure center.
F=Force, X=Location about X axis
Xcenter of pressure=(F1X1+F2X2+ ~ +FnXn)/(F1+F2+ ~ Fn)
In addition, an acceleration sensor is added to the foot to measure the Euler angle of the foot.
It is possible to estimate the walking stage and the angle of the tilted ground through the Euler angle of the foot and the pressure distribution data.
During the walking phase, the foot flat state when the sole is completely close to the ground can be found through processing the pressure center data. With the Euler angle of the foot at that state, the angle of the ground can be obtained. Also using the pressure data and the Euler angle, the body's current center of gravity and the ground state can be obtained through calculation with the body's Free-body diagram.
Conclusion
This algorithm can calculate accurate gait phase and floor conditions with only eight inexpensive pressure sensors on the soles of exoskeletal robots operating in a tilted walking environment. Also, the whole pressure distribution data across the foot can be obtained for further use.
Introduction
Evaluating disability is increasingly important in research as clinical care of people with multiple sclerosis (MS). Standard methods, such as the Expanded Disability Status Scale (EDSS), lack accuracy and reliability [1]. Body worn sensors allow a sensitive, objective and reproducible measure of disability. This study aims to investigate whether spatiotemporal gait parameters allow to distinguish between healthy subjects and patients with a moderate (EDSS: 2.5-5.0) or a severe (EDSS: 5.5-6.5) disability. In addition, reproducibility of spatiotemporal gait parameters and correlation with clinical measures has been investigated for all groups.
Methods
29 patients with secondary progressive MS (11 Male, 18 Female; age: 55.9 ± 9.3 years) and 24 healthy controls without walking disability (8 Male, 16 Female; age: 49.8 ± 8.4 years) were asked to attend two sessions (7-14 days apart) during which they performed a Six-Minute Walk test (6MW). Six inertial magnetic units (IMUs, Opal, APDM, Inc., Portland, OR, USA) were used. Spatiotemporal gait parameters from the control, moderate MS and severe MS groups were compared using a one-way analysis of variance (p=0.05). The test-retest reliability was investigated using Intraclass Correlation Coefficients (ICC), whereas the correlation against the validated measures was evaluated with a Spearman's rank test. A further analysis of the effects of age and gender was carried out.
Results
Significant differences were found between the three groups during 6MW across most of the gait parameters. Compared to the control group, stride length and velocity reduced in the severe MS group by about 35% and 55%, respectively. Additionally, high reliability with excellent reproducibility (ICC>0.75) was found within all three groups. Many parameters also showed strong correlations with the standard measures, especially with EDSS scores and Timed 25-foot Walk. A high correlation coefficient of about -0.73 was determined between Stride Length and EDSS. Age had a significant effect on Peak Arm Swing Velocity (p=0.045), whereas gender only on Peak Arm Swing Velocity (p=0.016).
Discussion
Wearable sensor technology gives an accurate and reliable assessment of disability for patients with MS. Furthermore, the strong association with the standard measures (e.g. EDSS) suggests that the body worn sensors could be used in research and clinical settings as an objective method to quantify the disability level. However, further investigations would be required to assess the long term reliability of the body worn sensors in detecting a patient's disability. Data over 24, 48, 96 weeks have already been collected for 36 patients.
Acknowledgements
UK EPSRC (EP/K03877X/1) and NIHR funded Sheffield Biomedical Research Centre.
References
[1] Cohen JA, et al., (2012). Lancet Neurol, 11: 467-76.
INTRODUCTION: Gait involves a rhythmic alternating sequence of events in which the body’s centre of mass progresses in a controlled manner over a changing base of support. While relatively stable, the gait cycle is characterized by subtle variations in the series of step and stride times as determined by the coefficient of variation (COV). Other measures, such as the fractal scaling index (FSI), show that the pattern of stride times has a highly organized structure of self-similarity at different scales. Studies show that valid assessments of step/stride time COV and FSI can be obtained using a waist-mounted accelerometer, and that these gait variability (GV) measures are sensitive to various pathological (e.g., Parkinson’s disease) and age-related changes in gait [1,2]. The ubiquity of these sensors in mobile phones provides an opportunity to use these devices to assess GV, and as such the purpose of this study was to validate the fidelity of an iPhone 6-based GV app (GaitDoctor©) to determine select temporal GV measures by comparing them to a criterion device (independent tri-axial accelerometer).
METHODS: Eight healthy adults completed a 9-minute walk at a preferred, self-selected pace around a 200 m indoor track. An iPhone 6 and a triaxial-accelerometer (GeneActiv, Cambridge, UK) were attached to the participants’ waists via a belt placed near L3. A peak detection algorithm was used to obtain the series of step and stride times from the anteroposterior acceleration signal [2]. Six dependent variables were determined for both devices: mean step/stride time, step/stride time CV and step/stride time FSI. The absolute agreement between the two devices for all dependent variables was determined using a type 3 (3,1) intraclass correlation coefficient (ICC). ICCs were interpreted as excellent (> 0.75), moderate (0.40-0.75) or poor (< 0.40).
RESULTS: The ICCs for all variables showed excellent levels of agreement. The correlations for step time CV (0.982), stride time CV (0.992), step time FSI (0.992) and stride time FSI (0.990) were highest, while the correlations for mean step and stride time were lower (0.793). The mean percent difference between variables measured by the two devices was 2.7% (Figure 1).
DISCUSSION: The results demonstrate that an iOS app (GaitDoctor©) running on an iPhone 6, can be used to obtain valid stride time measures for the purpose of assessing GV during natural, overground walking conditions. The use of a mobile phone will provide researchers with the opportunity to conduct large-scale studies of GV in different patient populations (e.g., MS, hip/knee OA and Parkinson’s disease).
REFERENCES:
Introduction
Conventional marker-based three-dimensional (3D) gait analysis is the current gold standard in assessing running biomechanics. Unfortunately, these systems are expensive and time consuming, making them impractical to most clinicians. Alternatively, low-cost depth sensing cameras (Microsoft Kinect v2) can now provide a more affordable and clinically accessible alternative. While the Kinect has been shown to be valid in tracking step times and gait speed, its accuracy in measuring more complex gait biomechanics remains limited [1]. Further, given the recent discontinuation of this system, there is an immediate need to develop novel methods for tracking human movement using raw depth sensing data that is system independent. Therefore, the purpose of this study was to validate the vertical oscillations (VO) from Kinect v2 depth data against a conventional marker-based system.
Methods
Twenty-four injury free adults (13F; age: 29±9 years; height: 170.6±8.4 cm; mass: 64.8±10.2 kg; gait speed: 2.8±0.1 m/s) volunteered for the study. An 8-camera Vicon system (200 Hz) tracked the vertical displacement of a pelvic marker cluster placed near their centre of mass during 1 minute of treadmill running. Simultaneously, a Kinect v2 (30 Hz) recorded raw depth data and tracked the vertical displacement of the pelvis using a novel iterative point cloud (ICP) and pelvis template tracking method.
The variable of interest was the average VO obtained over the first 12 seconds of the run. The agreement between the two systems was assessed using a two-way mixed intraclass correlation coefficient (ICC) for consistency and a Bland-Altman plot with 95% limits of agreement (LOA).
Results
The Kinect underestimated the Vicon VO by an average of 13.9 mm (Vicon: 92.8±16.7mm vs. Kinect: 78.9±15.5mm), but obtained excellent consistency (ICC = 0.86). After accounting for this systematic bias, the 95% LOA between the systems was ±16.1 mm (Figure 1).
Conclusion
The aim of this study was to validate VO from a clinically accessible depth sensor camera and a novel tracking method during running gait. Overall, the Kinect demonstrated excellent validity, with 95% LOA ±16.1 mm. However, additional improvements may be required to identify clinically relevant changes that have been observed in the order of 20mm [2]. Fortunately, all but three participants displayed Kinect VOs within ±10mm of Vicon VOs. Therefore, the novel tracking method appears to be successful for ~90% of runners, but may require additional tracking templates to account for some running patterns. The current study provides a successful first step in the validation of a novel and clinically accessible alternative to conventional marker-based 3D gait analysis.
References
1. Springer et al., (2016). Sensors. 16.
2. Heiderscheit et al., (2011). Med. Sci. Sports Exerc. 43.
With development of body movement algorithm, the application of inertial measure unit (IMU) has widely applied in human motion analysis. However, different hardware systems are distinguished from others which have specific data processing, results in various output results while in human motion research. Also, the pricey hardware recording systems and software data analysis programs limited the usage in clinical research. Therefore, the purpose of this study was to investigate the well-known IMU systems combined with self-programing analysis software to measure the lower limb joint motions during walking, and compared with optical motion capture system for validation.
In this study, four IMU systems which were Xsens MTw, APDM Opal, and NORAXON myoMOTION, were used to record human walking. The same subject was required to walk through a 10 meter walkway for 5 times with each IMU system separately, and the VICON motion system was captured in the same time. Raw data of the accelerometers, gyroscopes and magnetometers in IMU systems were extracted for joint motion calculation through a new self-programing iMO Version2.0.2 software (IMOTECH Inc). Then the data was programed into lower limb in three-axis joint motion, which was hip-knee-ankle joint flexion, rotation and abduction. All the joint motion data from IMU systems were compared to VICON system output data, and the Root Mean Square Error (RMSE) was calculated to understand the accuracy differences between each IMU system.
Results showed that RMSE in hip rotation in NORAXON (3.45±1.34°) and hip abduction in Xsens (2.19±0.35°) had great accuracy. The RMSE in knee flexion in Xsens (2.61±0.48°), knee rotation in NORAXON (2.56±0.53°) and knee abduction in NORAXON (2.36±0.27°) showed great validation. Also, the RMSE in ankle flexion in NORAXON (4.03±1.73°) and ankle rotation in Xsens (7.11±1.43°) had great accuracy. However, joint motion in APDM did not show much accuracy compared to two other systems.
In general, the NORAXON system has consistent accuracy in all IMU systems, and then is Xsens and APDM. According to our results, the IMOTECH software provide accurate joint motion similar to the best on-market IMU analysis software (around 2°) and support each brand of IMU systems without limitation of the hardware specifications or market set. The further application of IMOTECH is recommended to improve the IMU systems research in clinical research.
Introduction
Benign Paroxysmal Positional Vertigo (BPPV) is one of the most common disorders of the vestibular system, leading to a balance declination and an increased risk of fall. However, little research has directly assessed the balance ability in BPPV patients. With increasingly studies on the gait analysis through wearable devices, wearable sensors have been recognized as a reliable and affordable alternative for assessing the balance function of patient in clinics [1]. The purpose of this study was to quantitative access the balance disorders in patients with BPPV when standing and walking using wearable sensors.
Methods
Eighteen BPPV patients (age: 57.90±13.60 years, height: 161.80±6.54 cm, body mass: 60.58±10.22kg) and ten healthy subjects (age: 52.40±14.20 years, height: 165.00±8.08cm , body mass: 64.95±11.28 kg) were recruited. Acceleration data from two accelerometers, placed on the head and posterior trunk (L5 level) of each subject were collected along three orthogonal axes (vertical (VT), antero-posterior (AP) and medial-lateral (ML)) at a sampling rate of 150Hz under the following three conditions: walking at a self selected normal and comfortable speed, standing statically with eyes open for 30s (EO) and with eyes closed for 30s (EC) respectively. Two parameters, JERK and acceleration Root Mean Square (RMS) were calculated from the integration of the AP, VT, and ML components of acceleration for the assessment of standing balance. Two parameters, Harmonic Ratio (HR) and RMS in VT, AP and ML directions were calculated for the assessment of walking stability.
Results
Compared with controls, BPPV patients while static standing exhibited significantly higher JERKs (p<0.05) and acceleration RMS (p<0.05) in the EC condition, but no significantly differences between JERKs or acceleration RMS were found in the EO condition. BPPV patients in the EC condition also showed significantly lower standing balance than in EO condition (p<0.05)(Fig 1). In terms of walking stability, BPPV patients had significantly lower HRs along three directions at the posterior trunk and head than control group (p<0.05), with the exception in AP direction at the head. Compared with controls, BPPV patients exhibited increased acceleration RMS in ML direction (p<0.05) (Fig 1).
Discussion
This study presented a quantitative assessment of standing balance and walking stability of BPPV patients. Accelerometer-based analysis using wearable sensors would provided a practical and valuable assessment method for disease diagnosis in clinic.
Acknowledgement
This study was supported by the key technology support project of shanghai municipal science and technology commission, China (Grant No. 16441908200 and 13441902900).
Reference
1. Hubble R P, Naughton G A, Silburn P A, et al. Wearable sensor use for assessing standing balance and walking stability in people with Parkinson's disease: a systematic review[J]. Plos One, 2015, 10(4):e0123705.
Introduction
Research and development is underway to integrate augmented reality (AR) and neuromuscular gesture recognition as a more natural human-in-the-loop control system for remotely operated vehicles (ROV’s). Traditional ROV’s require extensive setup and bulky, unnatural control systems. AR headsets and neuromuscular gesture recognition devices have been shown to be robust and affordable commercial products. By integrating these wearable devices as a body mounted control system and user interface, an operator is granted the mobility and situational awareness to carry out additional tasks for a given mission. The system is analyzed to understand if wearable devices connected through the Internet of Things (IoT) allow a more responsive and natural human-in-the-loop control system for ROV’s. The study also analyzes if wearable heads-up-display (HUD), used in place of heads-down-display (HDD) for ROV control systems will increase operator situational awareness and response time.
Methods
A gesture recognition armband was worn around the operator’s forearm and read surface electromyography (sEMG) signals produced by their muscles. An untethered AR headset overlaid supplemental information as augmented images on the HUD. This allowed the operator to naturally view supplemental information provided by a ROV without losing situational awareness. The system was an IoT, enabling each component of the system to transmit and receive data over a dedicated network. The AR headset served as the central processing unit (CPU), processing sEMG signals and transmitting respective commands to a ROV. The ROV acted on the received commands and transmitted data describing its actions and its environment to be displayed on the HUD. An accurate library of 5 signal patterns that relate to a set of hand signals defined in US Army Publication TC3-21.60 were developed as a control set of commands. Signal processing and machine learning methods were implemented to reduce cross-talk and interference of weak sEMG signals to increase gesture recognition accuracy.
Results
Ten commands were given to both human and vehicle plants in ten separate trials of each variation. Variations include three ranges, three visibility environments, and three multi-task scenarios. The percent accuracy of executing the intended command was recorded and analyzed for each trial. To analyze how the control system affects user situational awareness, the user is required to perform three multi-task scenarios. Each scenario analyzed reaction time and percentage of task completion for both HUD and HDD control methods.
Discussion
Analysis results provide insight on the effectiveness of neuromuscular control compared to human-to-human instruction, and how wearable control systems can increase operator situational awareness. Integrating emerging technologies in AR, neuromuscular gesture recognition, and IoT provide a more natural human-in-the-loop control system for ROV’s by replicating human-to-human interaction for a human-to-vehicle interface.
Introduction
Shoulder pain is the most common site of musculoskeletal pain in manual wheelchair (MWC) users and can significantly limit function. Overuse, particularly during overhead and weight bearing movements, is thought to be a major causal factor. However, little is known regarding cumulative exposure to activities of daily living (ADLs) which pose shoulder impingement risk. To further understanding, it is important to objectively classify the type and quantify the frequency of ADLs performed in everyday life. This abstract presents preliminary data illustrating the use of inertial measurement units (IMUs) to estimate propulsion and non-propulsion activity and associated elevation angles in MWC users in their natural environments.
Methods
For lab-based validation, MWC users with spinal cord injury performed multiple MWC-related ADL trials: counter height and overhead reaching, cross-body backpack lifting, transfers, ramp and level ground propulsion. Acceleration data were acquired from one IMU (APDM Inc., 128 Hz) on the lateral upper arm. Video data were acquired at 60 Hz. Activity and peak detection algorithms [1] were applied to the acceleration data. Active time for propulsion and non-propulsion activities was validated by video comparison. Activity cycles were defined as acceleration data between consecutive peaks within activity segments. A trained feature extraction-based neural network model was developed and validated from lab data to identify propulsion and non-propulsion activity. Shoulder elevation angles were estimated from IMU orientation. Participants wore the IMU for 1-3 days in their natural environments; time spent in propulsion and non-propulsion activity and associated elevation angles were estimated from the IMU data.
Results
Four MWC users participated (29±6yr, injury levels T3-T6, 1 F). The mean (SD) propulsion and non-propulsion activity time detection accuracy was 97 (2) and 83 (6) %. Cross-validation yielded an area-under-the-curve of 0.97 for differentiating between propulsion and non-propulsion activity. Participants’ mean (SD) daily active time was 125 (44) minutes, with 18 (11) propulsion minutes, which is less than reported from wheel-mounted devices [2]. However, measuring arm activity is more directly applicable for shoulder injury risk estimation. Participants spent the majority of time with elevation angles between 20 and 90˚ during propulsion and with elevation angles <45˚ during non-propulsion activity (Table 1).
Discussion
Propulsion and non-propulsion activity and associated shoulder angles can be quantified in MWC users in their natural environments using one upper arm IMU. This will allow for shoulder injury risk estimation from overuse.
Acknowledgements
Mayo Clinic Rehabilitation Medicine Research Center, on behalf of the Craig H. Neilsen Fund for Spinal Cord Injury Care and Research Honoring Robert D. Brown Jr., M.D. and NIH (R01 HD84423).
References
1. Fortune, E. et al., (2015). Physiol Meas. 36(12):2519.
2. Oyster, M. et al., (2011). Arch Phys Med Rehabil. 92(3):484-90.
INTRODUCTION: A fundamental capability of the modern Soldier is the optimization of marksmanship under a variety of conditions. Understanding the influence of equipment on the ability to acquire targets, aim and fire weapons, and manage weapon recoil is crucial for Soldiers. Therefore, the purpose of this study was to assess the impact of a standardized Soldier fighting load on the kinematics of expert marksmen. METHODS: Full-body and rifle inertial measurement unit (IMU) data were recorded from seven expert marksmen (age: 29 ± 4.3 years; height: 1.7 ± 0.059 m; weight: 82 ± 8.8 kg) while completing a live-fire marksmanship course. All volunteers met the criteria of expert marksmen as defined by subject matter experts within the U.S. Army Marksmanship Unit (AMU) command, and were either members of AMU or were Maneuver Center of Excellence marksmanship instructors. Participants completed the course while unencumbered (CI) and encumbered (CII) by equipment (equipment weight: 2.8 and 25 kg, respectively), and completed two trials for each condition. The marksmanship course consisted of six sections, however, the presented data focuses on a dynamic component in which participants maneuvered in a serpentine around obstacles while firing at four stationary targets (Figure 1A). Participants were instructed to complete the course for speed and accuracy while ensuring they shot targets in the correct order, fired two rounds at each target, and hit within the specified zone of each target (Figure 1B). Dependent measures were calculated over specific subsets of the task as determined from the rifle-mounted IMU, defined as: I) initial shot, II) follow shot, III) recoil management (the range between the initial and follow shot), and IV) target acquisition (the range between the follow shot and the subsequent target’s initial shot). IMU-derived measures for the subsets were averaged over the four targets and across trials. Total successful target hits were also tabulated for each trial. Dependent measures were submitted to a repeated measures ANOVA to examine the main effect of equipment. RESULTS: Equipment caused 1.70s increased task completion time (p=0.001), 0.097m/s decreased movement speed (p=0.019), 11.13° increased mean torso lean angle (p=0.013), and 0.96° decreased standard deviation torso lean angle (p=0.039). In response to equipment, volunteers altered their non-trigger arm and torso motion during the initial shot (Figure 1C), as well as other body segments during subsets II to IV. However, there was no significant main effect of equipment on any IMU-derived measures of rifle motion or on successful target hits.
CONCLUSION: Expert marksmen maintained weapon shooting accuracy while encumbered, but had slower completion times and altered kinematics. Further analysis of the compensatory strategy utilized by encumbered expert marksmen could enable more rapid and enhanced Soldier marksmanship training and development.
Introduction
Wearable sensors containing accelerometers allow precise assessment of human movement, and quantitative comparison with previous or future assessments. A variety of commercially-available wearable sensors exist, possessing varying technical specifications, physical dimensions, and composed of different materials. Recommended sensor attachment locations and methods vary according to manufacturer also. Researchers choose accelerometers based on these differences, however the choice of sensor is not always obvious. Additionally, algorithm results may not be independent of accelerometer type. While each sensor technology has been validated against criterion movement analysis tools, little research exists quantitatively comparing data collected using different sensor brands.
Methods
In this study, we compare tri-axial accelerometer data collected simultaneously using four brands of wearable sensors during a 10m walking task; S1: Opal (±6g; 128Hz; APDM Inc., OR), S2: BiostampRC (±8g; 125Hz; MC10 Inc., MA), S3: Actigraph GT9X (±8g; 100Hz; ActiGraph LLC, FL) and S4: Delsys Trigno (±8g; 148.1Hz; Delsys Inc., MA). Three healthy participants (2 female; mean (SD) age=31.3 (6.4) years; BMI=23.6 (1.7) kg/m2) wore each sensor on both anterior shanks secured with surgical tape and bandages. Sensors were stacked in groups, with their axes aligned. The sensors were adhered to the skin and to each other, thereby minimising relative movement between sensors. Participants performed nine walks at self-selected speeds; three slow, three fast and three at normal speeds. A stopwatch was used to measure walking time and estimate gait velocity. Data analysis was conducted using Matlab (Mathworks, MA). All data were filtered using a 4th order low-pass butterworth filter with 5Hz cutoff frequency. For all sensor data, the anterior-posterior peaks corresponding to heel strike (HS) were detected using a standard peak detection algorithm. HS points were used to identify individual gait cycles (GC), and GC times were calculated. The frequency spectrum of the anterior-posterior signal during each GC was also examined and the spectral edge frequency (95% power; SEF) was computed. Mean GC times and mean GC SEF for each walk were compared for each sensor.
Results
Mean (SD) gait velocity was 1.34 (0.29) m/s, with a range 0.84-1.8m/s. Initial analysis indicates that GC time did not vary between sensors, Fig. 1. However, a more notable variation between sensors was observed in spectral edge frequency, Fig. 1.
Discussion
Preliminary results suggest that temporal features of gait may not vary with sensor brand, however, more variation in frequency-based features can occur. This may affect the results of algorithms using frequency-based features. Data collection and analysis across a larger population are ongoing, which will allow further investigation of these findings, including additional sensor locations (sacrum and bilateral ankles), angular velocity data and additional clinical balance tests.
Introduction: Data correction methods have been proposed to minimise the effects of local tissue-accelerometer vibration on data collected via skin mounted accelerometers [1]. It has been demonstrated that it is possible to measure the natural frequency (fn) and damping ratio (ζ) for a strap mounted accelerometer system, in order to estimate an amplitude correction as a function of frequency [2]. The aim of this study was to apply an amplitude correction to tri-axial accelerometer data collected from a strap mounted accelerometer system.
Methods: One participant was fitted with a tri-axial strap mounted accelerometer (GENEActiv, Action; 100 Hz) at the 4th lumbar vertebrae (L4). A variation on the nudge test [1] was performed whereby the strap was pulled down by approximately 2 cm then released whilst the participant was in a standing position. The participant then wore the device at L4 to record acceleration during daily activity. One hour of accelerometer data was used to examine the effects of applying a transmissibility correction.
Vertical acceleration data from the nudge test were utilised to determine the fn (11.37 Hz) and ζ (0.212) of the system [2]. An amplitude correction was estimated from Smeathers’ transmissibility equation [1] (Figure 1a). Further data processing was carried out in our custom written software (GADget©, v2.1). Spectra of one hour of accelerometer data were calculated for the resultant acceleration, by performing Fourier transforms of contiguous rectangular frames of 5 seconds duration, on data with and without the transmissibility correction [1].
Results: The frequency spectra of one hour of accelerometer data with the transmissibility correction applied illustrated lower amplitudes as a function of frequency below 16.08 Hz (Figure 1b & c). For data without the transmissibility correction (Figure 1b) the spectrum plateaus above approximately 20 Hz as opposed to steadily increase when the correction was applied (Figure 1c).Discussion: When the transmissibility factor (Figure 1a) falls below unity (16.08 Hz), the predicted measurements will be attenuated by transmissibility and therefore the correction will amplify the result. This can explain the effect seen above 16.08 Hz in Figure 1c. The same value is also close to the frequency above which the uncorrected spectrum (Figure 1b) is nearly flat, which is a characteristic of random noise. This first attempt to correct strap mounted accelerometer data suggests Smeathers’ transmissibility correction may be applied effectively up to the frequency threshold corresponding with the cut-off frequency of the transmissibility function, and thereafter is likely to amplify noise within the data.
Acknowledgements: Funding received from the University of Wolverhampton, Early Researcher Award Scheme
References:
INTRODUCTION
Inertial Measurement Units , have become a conventional instrument for monitoring of human motion during activities of daily living [1, 2]. The detection of foot contacts (FCs) is a key element for the quantitative assessment of motor performance for several applicative purposes, from gait analysis to motor competence evaluation. Several different algorithms have been proposed for FC identification during common tasks, like walking and running [2-5]. These algorithms are mostly task specific and cannot be generalized. Wavelet-based methods have been proposed for the identification of transient events in biomedical signals [6]. FCs can be considered transient events, associated to a transfer of mechanical energy between the foot and the ground. The aim of this work was to assess the performance of a wavelet-based energetic approach (WBEA) for the detection of FCs during different motor tasks.
METHODS
Three healthy subjects were recruited for the study (2F, 1M; 27±4 years; 160±10 cm; 57±10 kg). They performed 8 different exercises: walk, run, leap, hop, horizontal jump, tandem walk, gallop and slide. Reflective markers were attached on heels, and tri-axial inertial sensors (Opal, Apdm, US) to the lower legs. Marker 3D kinematics (SmartD, Bts, Italy) and leg acceleration were collected at 200Hz and 128Hz, respectively, ground reactions (Bertec, USA) at 500 Hz. FCs were identified on the vertical (V) position of the markers (GS), and on the V acceleration signals. Leg V acceleration was decomposed into 20 wavelet resolution levels, D1-D20 (moving from high to low frequencies). FCs were identified as the maximum peak on D1.
RESULTS
A minimum of 18 FC per subject were identified for a total of 64 FCs. Median absolute error was 0.03s (25th and 75th percentiles, 0.02 and 0.05s). Mean difference was positive and close to the median value (0.03s), showing bias in the identification. The same performance was observed for all tasks except for gallop, which showed the highest mean absolute difference of 0.07s.
DISCUSSION
WBEA was found an accurate method for the detection of FC for different motor tasks. When compared to other approaches, the proposed method does not rely of specific waveform, but only on energy transfer and can be applied, with similar performance, to different motor tasks.
REFERENCES
[1] Godfrey Med Eng Phys. 2008 Dec;30(10):1364-86 2015
[2] Trojaniello et al, Gait Posture. 2014 Sep;40(4):487-92
[3] Trojaniello et al, Gait Posture. 2015 Sep;42(3):310-6
[4] Bergamini et al, J Biomech. 2012 Apr 5;45(6):1123-6
[5] Lee et al, J Sci Med Sport. 2010 Mar;13(2):270-3
[6] Magosso et al, Applied Mathematics and Computation. 2009; 207:42-62
Introduction
The single leg squat (SLS) test is useful for clinical assessment of strength, flexibility, balance, and motor control. Accurate measurements of 3-D joint kinematics are necessary for detailed analysis of the motion. Although marker-based motion capture systems provide highly-accurate positional data, they require a dedicated lab space and lengthy experimental set-up and data processing. Low-cost depth cameras, such as the Microsoft Kinect, provide a marker-free alternative with sacrifices in sensor accuracy. This study evaluates the utility of a depth sensor in capturing knee kinematics during SLS by direct comparison with a ground-truth motion capture system. Further, a method for improving Kinect joint center estimates through rigid-body constraints and a filtering algorithm is presented.
Methods
Time-synchronized squat data were simultaneously recorded by a single depth camera (Kinect 2, 30Hz) and an active marker motion capture system (Phasespace, 480 Hz). Forty-nine LED markers were placed on anatomical landmarks, following a modified Plugin-Gait marker protocol. Functional joint centers were computed from the active marker trajectories, providing a ground truth measurement of joint angles. The noisy joint centers from the depth camera were filtered using a rigid-body model, preserving limb lengths and enforcing position and angle limits. Subject-specific limb lengths were estimated using height based allometry [2]. Joint states were recovered using an Unscented Kalman Filter [1], modelling both the system and measurement error.
Six healthy subjects (age 29.5 ± 6.3 years, 1F, 5 M) were recruited under IRB approval. Each performed three trials consisting of three single-leg-squats on each foot (108 total motions). Subjects were instructed to squat as low as comfortably possible at their own pace.
Results
Peak knee flexion and frontal-plane knee position (relative to a pelvic coordinate system) were evaluated. The knee displacement was measured along an axis running through the hip joint centers. The error of the raw and filtered Kinect data was computed against the ground truth. The proposed method shows improvement in the peak knee flexion error: filtered (5.38 ± 5.31 degrees) vs raw (9.57 ± 5.70 degrees), and comparable frontal plane displacement error: filtered (2.61 ± 2.17 cm), raw (2.80 ± 2.34 cm).
Discussion
These results demonstrate the efficacy of using low-cost depth cameras for clinical analysis of the SLS motion. The proposed method of applying rigid-body constraints has been shown to improve the accuracy of the recovered motion metrics. Based on these initial findings, the utility of the developed depth camera system to inform clinical decisions will be tested in subjects with motion disorders.
References
[1] Chaffin et al. 2006,
[2] Julier and Uhlmann, 1997,
[3] Anderson et al., 1986
Introduction
Motion analysis based on skin markers tracking is widely used particularly in clinical and sports biomechanics. Two main limitations are generally reported: On one hand, soft tissue artefact due to deformable connection between skin and bones, yields non-consistent joint kinematics. Although optimization methods are widely used, their limitations are well known (Cereatti et al. 2017). On the other hand, skeleton scaling only provides approximate bone morphology. Our aim is to propose an alternative finite element based approach using skin markers tracking and 3D bone reconstruction from biplanar X-Rays.
Methods
The approach was first implemented considering the lower limb. From biplanar X-rays, 3D reconstruction of the pelvis, femur and tibia was performed using previously described methods. While 3D detailed subject specific joint morphology was considered for gait analysis allowing to investigate parameters such as femoral head coverage, STA reduction was based on a simplified bone modelling considering a set of high stiffness beams connecting bone landmarks, for example for pelvis left/right acetabulum and left/right iliac spines, respectively anterior and posterior. Two element types connected each skin marker Msi to its corresponding bone landmark Bi: combination of springs connected Msi to a subcutaneous point Msci and accounted for all the soft tissue deformability, while a stiff beam connected Msci to Bi. Each hip joint was modelled using a stiff bar (HJ) joining centers of acetabulum and femoral head, thus allowing free rotation while controlling translation using the HJ length (0,001 mm in this first model); the same approach was considered for knee joints (figure 1). Then Ms (skin markers) displacements were introduced for each time frame of the gait cycle and the resulting Msc and B nodes displacements were computed using ANSYS software taking into account geometric non linearities.
Results
The model was applied on 85 healthy subjects (age:18-59years) that performed both EOS biplanar X-rays and gait analysis using plug-in-gait markers protocol. The whole model comprised 62 nodes and 88 elements. Computations were fast, robust, with consistent joint motion as controlled by the joint bars length. Detailed morphology allowed consistent investigation of femoral head coverage during gait.
Introduction
Gait quality characteristics estimated from daily-life trunk accelerometry can contribute to the identification of individuals at risk of falls [1-3]; older people at high risk for falls tend to walk with a lower stride frequency, lower gait intensity, lower gait symmetry, higher gait smoothness, lower regularity and less stable gait pattern. Since older adults with high fall risk tend to walk slower than older adults with a lower fall risk, walking speed may underlie differences in gait quality characteristics. We investigated the effect of walking speed on gait quality characteristics among older adults.
Methods
Trunk accelerations of 11 healthy older adults (mean age 69.6 ± 4.1 years, 6 females) were recorded during 5 minutes of treadmill walking at four different speeds (0.5, 0.8, 1.1, and 1.4 m/s). From these trunk accelerations we calculated step frequency, root mean square (intensity), harmonic ratio (symmetry), index of harmonicity (smoothness), sample entropy (regularity) and logarithmic divergence rate per stride (stability) for the VT, ML and AP direction where appropriate. The effect of walking speed on the gait quality characteristics was examined using a one-way repeated measures analysis of variance (ANOVA) or a non-parametric Friedman test. Post-hoc paired t-tests or Wilcoxon signed ranks test with a Bonferroni correction were used to identify where the specific differences occurred between the four speeds.
Results
All gait characteristics were affected by walking speed, except sample entropy in antero-posterior (AP) direction (Figure 1). An increase in walking speed resulted in a higher step frequency, higher standard deviation, more symmetric gait, more smooth vertical (VT) accelerations, less smooth accelerations in medio-lateral (ML) and AP directions, less regular dynamics in ML direction, more regular dynamics in VT direction, and a more stable gait pattern overall.
Discussion
Our findings suggest that lower walking speed will result in a lower gait quality, and may determine differences in gait quality between older fallers and non-fallers. The use of a treadmill was necessary to precisely control walking speed without fluctuations, yet may limit generalizability of our results to daily-life. Yet, changes in gait quality characteristics based on daily life accelerometry and observed in individuals at risk of falling may reflect impaired neuromuscular control of gait, but may also be determined by low walking speed.
References
[1] van Schooten, et al. J Gerontol A 2015;70:608–615.
[2] Rispens, et al. JMIR Res Protoc 2015;4:e4.
[3] Weiss, et al. NNR 2013;27:742–52.
Figure 1: White bars indicate values at a walking speed of 0.5 m/s, light grey bars at 0.8 m/s, grey bar at 1.1 m/s, and dark grey bar at 1.4 m/s. Horizontal brackets denotes a significant difference (* p < 0.05) between the different walking speeds.
10:30 - 10:50
The rise of consumer fitness trackers, smartphones, and smart watches offers an unprecedented opportunity to examine physical activity in free-living populations worldwide. The Mobilize Center, a Big Data Center of Excellence at Stanford University, is analyzing movement data from 6 million individuals in over 100 countries around the world using a smartphone app for activity and health tracking. This analysis has revealed new insights about physical activity levels around the world and what factors are predictive of these activity levels. Further, we are developing a new methodological framework for studying health behaviors, like physical activity, using messy, but massive datasets from phone based intertial measurement units.
10:50 - 11:10
Background: Until recently, mobility was generally assessed in one of two manners. Quantitative studies measured mobility in the lab or clinic, while self-report was used to evaluate a subject's community ambulation and everyday mobility. Of course, self-report has well-known limitations. Recent work using wearable sensors allows for the quantitative assessment of movement and mobility on a continuous basis, as subjects carry out their routine activities of daily living in the community and environment, e.g., on a 24/7 basis. Here we address the question: is there added value to such recordings, above and beyond the conventional one-time assessment of gait and mobility in the lab?
Methods: This presentation will summarize recent work that quantified the everyday movement pattern on a continuous basis, e.g., 24/7, in older adults, elderly fallers, patients with Parkinson's disease, and older adults with mild cognitive impairment. We describe the new set of metrics that can be derived from continuous and illustrate some of the advantages. For example, with continuous monitoring, multiples bouts of walking can be quantified and characterized over a 1 week and the "typical" gait pattern as well as the bout-to-bout variations can be assessed. This stands in contrast to the conventional testing, where typically a single test is relied upon as a snapshot that represents the subject's every day's functioning.
Results: Combining metrics derived from continuous monitoring of movement with machine learning techniques, we find significant improvements in the ability to discriminate between a) older adults with and without a history of falls; b) patients with mild Parkinson's disease and older adults; and c) older adults with and without mild cognitive impairment. The ability to predict future falls among patients with Parkinson's disease is also markedly improved using metrics based on continuous monitoring, compared to one time, conventional measures. In addition, we show that the associations between measures taken in the lab and measures based on continuous monitoring are only mild to moderate, underscoring the idea that 24/7 monitoring captures different aspects of mobility compared to conventional measures.
Conclusions: These results, in multiple cohorts, demonstrate the feasibility, utility and added value of continuous 24/7 monitoring of movement and mobility.
11:10 - 11:20
Introduction: The quantification of human movement has been under ongoing technical development and the unrestricted functionality of gait, balance and cognitive functions are essential predictors of a high quality of life. Limitations of these functions result in an increased risk of falls and injuries. In general two different settings coexist to assess gait i) laboratory based and ii) home-like assessments. Laboratory based assessments are often used to quantify standardized movements while in the home-like assessment patients are monitored in their usual environment. This raises the question of how activities like walking, turning and postural transition (PT, i.e. sit-to-stand and stand to sit) are identified and validated. The aim of this study is to develop algorithms for the quantification of such activities and to compare them against a 3D motion capture system and video observation, which serve as the gold standard.
Method: In this study participants were monitored in a home-like environment wearing a 3D motion sensor (Mobility Lab, Opals, APDM, USA) on the lower back. The study population consisted of a training group of five Parkinson’s Disease (PD) patients and one older adult (OA), and a test group of 21 PD patients and 11 OAs. The participants were asked to perform a variety of tasks (e.g. ironing, cleaning, brewing coffee) while being video recorded. Walking, turning and PT movements were identified and algorithms developed accordingly. The developed algorithms are based on 6DOF i.e. the accelerations and angular velocities of the lower back.
Results: The detection accuracy of steps was 88% for PD patients and 89% for older adults. The detection accuracy of turns was 91% for all participants and 92% for PD patients. The detection of PTs yielded in accuracies of 79% for all participants, 83% for PD patients, and 66% for patients with dyskinesia with an overall movement direction detection accuracy of 98%.
Conclusion: The development of validated algorithms is of crucial importance when it comes to individual, patient-related assessments, especially in the home environment [1-2]. Based on the results from validated algorithms we can test medication and therapy strategies or disease progress. Assessments that use inertial measurement units are often "black boxes" and the extracted parameters are rarely validated. A review of such standard parameters with gold standards is a necessity especially with regards to the clinical interest in daily activity (e.g. getting up, walking, turning, sitting, and lying). If algorithms are validated, conclusions can be drawn about the functional activity of the patient and further evaluations of the quality of the patient´s life are possible.
[1] Pham MH. et al. (2017). Frontiers in Neurology, 8, 457.
[2] Pham MH. Et al. (2017). Frontiers in Neurology, 8, 135
11:20 - 11:30
Locomotion is an important behavior in comparative biomechanics for both terrestrial and marine animals. Measures of animal locomotion during traveling, foraging and socializing are key to understanding and monitoring behavior, territory use, health, welfare, and response to anthropogenic disturbances. However, behavioral data from animals in the wild can be difficult to obtain. This is particularly true for marine animals that spend the majority of their time underwater. To address these challenges, bio-logging tags are often used to collect movement data for days or weeks at a time. While these data can be scored by trained human observers, machine learning strategies for analysis and classification of these increasingly large data sets are key for efficient and effective application of persistent monitoring.
In this work, six bottlenose dolphins (three mother-calf pairs, Tursiops truncatus) were tagged in Sarasota Bay, Florida. After tag deployment, a boat-based focal follow was performed by expert observers to assess general activity states and behaviors of the tagged pairs. Five basic locomotion modes (fast, medium, and slow travel along with rest and milling behaviors) were scored. Human observations were used as ground truth to train a novel machine learning framework. The proposed framework resulted in a) the selection of an optimal window size during feature generation; b) a best case feature set for classification; and c) increased classification accuracy by incorporating sequential temporal information. Furthermore, the proposed framework includes a general purpose feature library for initial feature generation, which makes it applicable to other bio-logging sensor based behavior studies as well.
Our analysis focused on the night period (5pm – 7am, 84 hours of data) when direct human observations are incomplete. During this time the swimming modes of the mothers and calves were strongly correlated (82% of time), however, calves were noticeably more active. Calves spent 80% and 25% more time in fast swimming and milling respectively. Interestingly, dolphin activity increased shortly after sunset, decreased slowly through midnight and dropped significantly at dawn. Classification accuracy for the combined framework was 76%, a 5% increase over results that did not use the sequential temporal information. Notably, it took around 100 features for the single frame classifier to reach its best accuracy, while only 27 were required in the sequential classification.
The proposed mobile monitoring method facilitates the study of dolphin behavior, particularly during periods of time when human observations are limited. Unlike terrestrial animal locomotion study, there are few existing studies of marine animals to compare this work to. Even so, performance can be further improved by obtaining higher fidelity ground truth data from the field observers (e.g. increase the frequency of focal follow recordings etc.) over a larger number of animals within the resident population of Sarasota Bay dolphins.
11:30 - 11:40
Introduction
The identification of heel strike and toe off, referred to as gait events (GE), is a crucial issue in human gait analysis [1]. In particular, with the wide-spread use of wearable sensors (IMUs), a great number of algorithms were proposed in the literature and applied for the purpose, with different methodological characteristics such as different IMU location, analysed variables and computational approaches. On the other hand, only few studies addressed the comparison of the algorithms performance, and never approaching the analysis from a comprehensive review, investigating the influence of the different criteria, rather than evaluating each proposed algorithm as a whole. Therefore, the aim of this study was to analyse the influence of the selected methodological characteristics, in terms of accuracy and repeatability, in GE detection from IMU measures, using the algorithms identified from a systematic literature review.
Methods
A systematic literature review was performed identifying 17 algorithms for GE detection from IMU measures. The identified approaches were classified based on:1) IMU position, 2) analysed variable (i.e. acceleration or angular velocity), 3) computational approach (i.e. peaks identification in time or frequency domain wavelet transform, adaptive threshold, zero crossing). Thirty-five healthy volunteers (17F, 18M; 26.0±3.8y.; 1.72±0.08m; 69.0±13.1Kg) were recruited for this study. Five tri-axial IMUs (Cometa, Milano, fc285Hz) were positioned on the lower trunk, shanks and feet of each participant. Participants were asked to walk for 2 minutes at their self-selected comfortable speed. Measures of ground reaction forces were acquired using two force platforms (Kistler, Switzerland, fc1000Hz) and adopted as reference for GE identification [2]. Algorithms were implemented to identify GEs from IMU measures. Median, 5thand 95thpercentile values of the errors were calculated.
Results
Box plots of the errors are reported in Figure 1.
Discussion
Comparable accuracy and repeatability were obtained for shanks and feet IMU position, while worst performance was observed for trunk-based algorithms (residual errors Median(5th; 95th percentile) for the best performing algorithms were 52(11;108)ms, 39(-9;72)ms and 53(8; 87)ms, respectively). Thus, IMUs in closer proximity to the foot ground contact point seem to facilitate GE detection, in line with what reported by Trojanello et al. [3]. Moreover, angular velocity-based algorithms performed better than acceleration-based ones (errors: 39(9;72)ms, 43(-38;100)ms, respectively). Considering mathematical approach, peaks identification after wavelet filtering or adopting adaptive thresholds (errors:39(-9;72)ms, 53(8;87)ms, respectively) seem to perform better than the other analysed approaches (peaks identification in the time domain 52(-10;108)ms, zero crossing 39(-98;96)ms). These results will be extended to patients with specific gait abnormalities.
References
[1] Benedetti et al.,1998 [2] Zeni et al.,2008 [3] Trojanello et al.,2014
11:40 - 11:50
Introduction:
Adult traumatic brachial plexus injuries (BPI) are devastating and often result in a complete loss of motor function in the affected upper extremity (UE). Surgical restoration of UE motor function has varying degrees of success. Quantifying functional outcome is necessary to evaluate the success of surgical reconstruction. Function is typically evaluated using a muscle grading system [1]. This approach assesses muscle activation, range of motion, and strength, but does not necessarily indicate functionality [2]. Activity monitoring using triaxial accelerometers provides a greater opportunity to evaluate function in the free living environment [3]. Accordingly, this study analyzed bilateral activity of UE in patients who have undergone surgery to restore arm function after a BPI. It was hypothesized that subjects who have had brachial plexus surgical reconstruction would exhibit more symmetrical UE activity when compared to those individuals who had not had treatment of their BPI.
Methods:
Seventeen subjects (7 healthy controls, 6 pre-BPI reconstruction, 5 post-BPI reconstruction) participated in this IRB approved study. Upon providing consent, subjects were asked to wear four triaxial accelerometers (ActiGraph GT3X+, Pensacola, FL) on bilateral forearms and upper arms for four days. Activity data was collected at 50 Hz. Subjects were instructed to conduct their normal daily activities during the data collection period. Acceleration data were exported from the device (ActiLife, Pensacola, FL) and custom MATLAB code (MathWorks, Natick, MA) was used to filter the data and partition it into 60 second epochs. Methods presented by Hurd et al. [3] were used to calculate the asymmetry index between limbs. Group differences were explored using the Tukey-Kramer method.
Results:
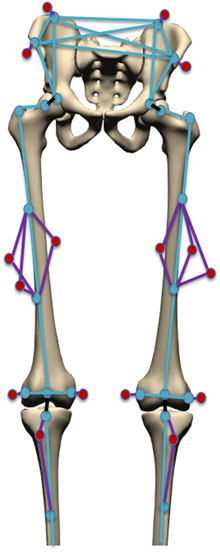
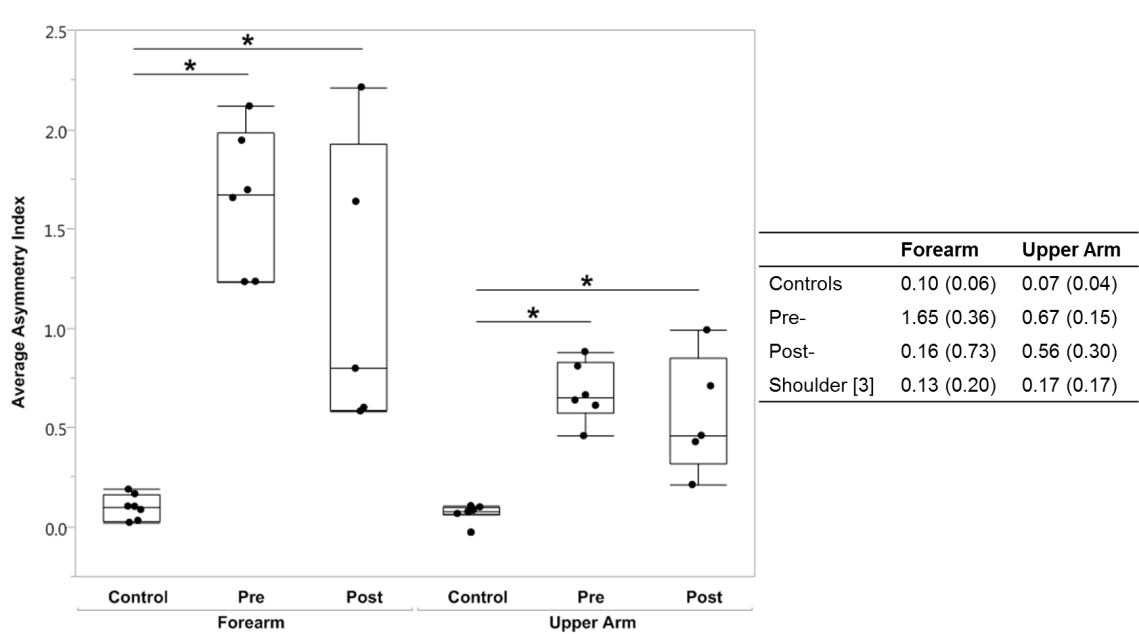
An asymmetry index closer to 0 indicated more symmetry between sides. Control subjects were the most symmetrical. Asymmetry indices for all subjects with BPIs were significantly different from controls (Figure 1). While the asymmetry indices of the post-reconstruction group trended towards control values, they remained significantly different.
Discussion:
Asymmetry index has been used previously to evaluate patients with shoulder pathology [3]. In this study, all subjects with BPIs were substantially more asymmetric than patients in the aforementioned study. This could indicate that BPIs have a greater impact on motion than shoulder pathology.
Analyzing the activity of UE following treatment of BPI allows for quantitative assessment of functionality in daily life. Further studies comparing activity before and after treatment could provide insight into the efficacy of the surgical treatment and aid in guiding clinical practice.
Acknowledgements:
Fellowship funding (CMW) provided by NIH T32-AR056950 and the Mayo Clinic Graduate School of Biomedical Sciences.
References:
1. Barrie KA, et al. Neurosurg Focus 16(5), Article 8, 2004.
2. Riddoch A, et al. War Memorandum No. 7. 1943.
3. Hurd WJ, et al. J Electromyogr Kinesiol 23, 924-929, 2013.11:50 - 12:00
Introduction
Concussion is one of the most common injuries across a myriad of sports. With the exception of concussion history, little is understood about the potential risk-factors for injury1. Recent research has indicated that poor tackle technique increases an individual’s risk2, while movement control training can reduce Rugby Union players risk of concussion3. Research has yet to evaluate the association between discrete measures of motor function and concussion. Therefore, the aim of this study was to prospectively investigate the association between dynamic balance control, a discrete measure of sensorimotor function, and subsequent concussion injury diagnosis.
Methods
109 elite Rugby Union players were recruited from an Irish professional Rugby Union team and the Irish National Under-20 team. Participants were prospectively evaluated in Y Balance Test performance, quantified with a single lumbar worn inertial sensor at pre-season or mid-season, and followed during the 2016/2017 season. Concussion incidence was recorded during the follow-up period.
Results
Participant demographic data (mean ± SD) was as follows: age: 22.6±3.6 years; height: 185±6.5 cm; weight: 98.9±12.5 Kg; BMI: 28.9±2.9 kg/m2; leg length: 98.8±5.5 cm. Of the 109 players, 44 (40.3%) had a previous history of concussion, while 21 (19.3%) sustained a concussion during the follow-up period. Players with sub-threshold anterior direction gyroscope magnitude sample entropy demonstrated a three-times greater relative-risk of sustaining a concussion.
Discussion
Rugby Union players who possess poorer dynamic balance performance during the Y Balance Test have a three-times higher risk of sustaining a sports-related concussion. These findings have important implications for future research and clinical practice, as this novel digital biomarker identifies a potential modifiable risk-factor. The Y Balance test, quantified via a single inertial sensor, may be leveraged to help identify those who may benefit from targeted interventions designed to reduce concussion risk. Further research is required to investigate this association in a large cohort, consisting of males and females across a range of sports.
Acknowledgments
Funding for this study was provided by the Science Foundation of Ireland (12/RC/2289).
1. Abrahams S, Fie SM, Patricios J, et al. Risk factors for sports concussion: an evidence-based systematic review. British journal of sports medicine. 2014; 48(2):91-97.
2. Tucker R, Raftery M, Fuller GW, et al. A video analysis of head injuries satisfying the criteria for a head injury assessment in professional Rugby Union: a prospective cohort study. Br J Sports Med. 2017; 51(15):1147-1151.
3. Hislop MD, Stokes KA, Williams S, et al. Reducing musculoskeletal injury and concussion risk in schoolboy rugby players with a pre-activity movement control exercise programme: a cluster randomised controlled trial. British journal of sports medicine. 2017; 51(15):1140.