To save this page as a PDF, click this button and choose the PDF destination.

Poster Session 1

12:15 - 12:45 Tuesday, 6th July, 2021

Sessions Poster Session


12:15 - 12:16

16 Characterisation and Defect Analysis of 2D Layered Ternary Chalcogenides

Mr. Tigran Simonian1,2,3, Dr. Ahin Roy1,2,3, Prof. Zdeněk Sofer4, Prof. Valeria Nicolosi1,2,3
1Advanced Microscopy Lab, Trinity College Dublin, Dublin, Ireland. 2CRANN/AMBER, Trinity College Dublin, Dublin, Ireland. 3School of Chemistry, Trinity College Dublin, Dublin, Ireland. 4University of Chemistry and Technology Prague, Prague, Czech Republic

Abstract Text

TlGaX2 [X = Se, S, Te] is a family of layered 2-D ternary chalcogenides. These p-type semiconductors have band gaps within the green to ultraviolet range [1] [2] [3], which makes them ideal candidates for optoelectronic applications.

Current examples of such applications, such as phototransistors [4] and detectors [5] [6], make use of multistep processes, such as mechanical exfoliation with a PMMA transfer [4], or thin film synthesis via thermal evaporation [6], which makes potential future scalability of these devices cumbersome. Liquid phase exfoliation (LPE) is a far more facile process that has been shown to work for a large number of layered van der Waals materials [7]. Herein, we demonstrate that these TlGaX2 materials can be exfoliated with a facile one step sonication in IPA, leaving behind little to no residue.

While there have been a number of studies into the electronic structure of these materials, an exact description of their band structures has yet to be established [6]. Interestingly, despite defect quantification being an important structure-property relationship in semiconductors, none of its aspects, e.g. stoichiometry, charge states, structural defects, etc., have yet been fully addressed. For example, while it was reported that Se vacancies in TlGaSe2 can lead to a change in the nature and size of the bandgap, a quantitative relationship was not determined [2].

In this work, we use high-resolution scanning transmission electron microscopy (HRSTEM), in combination with EDX/EELS, to experimentally address this aspect of defects in TlGaSe2. Our experiments clearly indicate the presence of stacking faults (as were seen previously in XRD studies with bulk TlGaSe2 [8], and with isostructural KInS2 [9]) and surface relaxation in LPE-TlGaSe2. Furthermore, we show a transient formation of a 1-D structure along the edges of TlGaSe2 flakes, catalysed by intense electron beam exposure in the microscope. Using complimentary density functional theory (DFT) simulations, we explore the effect of defects on the electronic structure, and rationalise the transient formation of the 1-D structure.

Keywords

TlGaSe2, HRTEM, HRSTEM, EDX, EELS, DFT, Characterisation

References

[1] A. T. Nagat, G. A. Gamal, and S. A. Hussein, “Growth and Characterization of Single Crystals of the Ternary Compound TlGaTe2,” Cryst. Res. Technol., vol. 26, no. 1, pp. 19–23, 1991.


[2] A. Cengiz, Y. M. Chumakov, M. Erdem, Y. Şale, F. A. Mikailzade, and M. Y. Seyidov, “Origin of the optical absorption of TlGaSe2 layered semiconductor in the visible range,” Semicond. Sci. Technol., vol. 33, no. 7, 2018.


[3] S. Duman and B. Gürbulak, “ Urbach Tail and Optical Absorption in Layered Semiconductor TlGaSe 2(1- x ) S 2 x Single Crystals ,” Phys. Scr., vol. 72, no. 1, pp. 79–86, 2005.


[4] S. Yang et al., “Ultrathin ternary semiconductor TlGaSe2 phototransistors with Broad-spectral response,” 2D Mater., vol. 4, no. 3, 2017.


[5] I. M. Ashraf et al., “Development and characterization of TlGaSe2 thin film-based photodetector for visible-light photodetector applications,” Opt. Mater. (Amst)., vol. 103, no. December 2019, p. 109834, 2020.


[6] S. Johnsen et al., “Thallium chalcogenide-based wide-band-gap semiconductors: TlGaSe 2 for radiation detectors,” Chem. Mater., vol. 23, no. 12, pp. 3120–3128, 2011.


[7] V. Nicolosi, M. Chhowalla, M. G. Kanatzidis, M. S. Strano, and J. N. Coleman, “Liquid exfoliation of layered materials,” Science (80-. )., vol. 340, no. 6139, pp. 72–75, 2013.


[8] D. F. McMorrow, R. A. Cowley, P. D. Hatton, and J. Banys, “The structure of the paraelectric and incommensurate phases of TlGaSe 2,” J. Phys. Condens. Matter, vol. 2, no. 16, pp. 3699–3712, 1990.


[9] L. Kienle, V. Duppel, A. Simon, M. Schlosser, and O. Jarchow, “Real structure of KInS2 polytypes,” J. Solid State Chem., vol. 177, no. 1, pp. 6–16, 2004.


12:16 - 12:17

51 Probing the dielectric polarization properties of biological molecules on the molecular scale

Harriet Read1, Rene Fabregas1, Pablo Ares1, Thomas Waigh1, Laura Fumagalli1,2
1Department of Physics and Astronomy, University of Manchester, Manchester, United Kingdom. 2National Graphene Institute, University of Manchester, Manchester, United Kingdom

Abstract Text

The structure and biological functions of essential biomolecules such as proteins and nucleic acids are driven by electrostatic interactions, which in turn crucially depend on the dielectric polarization properties of the interacting molecules and the water molecules that surround them. Knowledge of these properties is therefore of paramount importance to get an insight into biomolecular structure, dynamics and hydration [1]. However, probing the dielectric response of biomolecules on a molecular scale has traditionally been a technical challenge due to the lack of tools with sufficient sensitivity. In recent years, great advances have been made based on the use of a novel scanning probe microscopy technique, scanning dielectric microscopy, which allowed researchers to probe the dielectric constants of DNA condensed inside single viruses [2,3], lipid biolayers [4,5] and confined water [6], amongst others. Here, we present our more recent advances in which we applied this technique to single self-assembled I3K peptide chains and monolayers of lysozyme proteins in aqueous solution. We show that, by using a conductive AFM tip and substrate as electrodes, the capacitive response of the molecules to the applied voltage can be measured directly on the molecular scale at MHz frequencies. The dielectric polarization properties of the molecules are then extracted from the measured capacitive interaction by means of detailed finite-element calculations. This work is another important step towards our understanding of dielectric properties of biomolecules on the molecular scale and it offers much needed feedback for theories describing electrostatic interactions in biology.

Uncaptioned visual

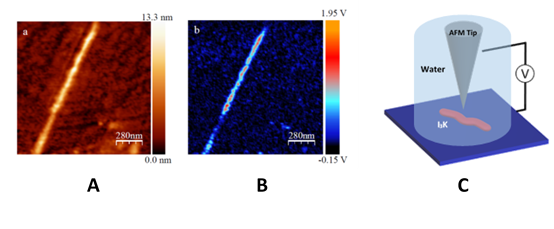
Figure 1  (a,b) Topography and corresponding dielectric image of an I3K peptide chain adsorbed onto a silicon wafer taken in aqueous solution. Dielectric contrast is clearly detected over the peptide chain. (c) Simplified schematic of the tip-sample system under study using the in-liquid scanning dielectric microscopy. 

Keywords

Scanning Probe Microscopy, Atomic Force Microscopy, Scanning Dielectric Microscopy, Peptides, Proteins, Dielectric polarisation properties

References

[1]  B. Honig, A. Nicholls, Science 268, 1144 (1995).

[2]  L. Fumagalli, D. Esteban, A. Cuervo, J.L. Carrascosa, G. Gomila Nature Mater. 11, 808 (2012)

[3]  A. Cuervo, P.D. Dans, J.L. Carrascosa, G. Gomila, L. Fumagalli PNAS, 111, 362 (2014)

[4]  G. Gramse, M. A. Edwards, L. Fumagalli, G. Gomila Appl. Phys. Lett 101, 213108 (2012)

[5]  A. Dols-Perez, G. Gramse, A. Calò, G. Gomila, L. Fumagalli Nanoscale 7, 1832 (2015)

[6]  L. Fumagalli, A. Esfandiar, R. Fabregas et al. Science 360, 1339 (2018)


12:17 - 12:18

94 Characterizing nanomechanical properties of comedones after treatment with sodium salicylate

Dr. Zeinab Al-Rekabi1, Dr. Anthony Rawlings2, Dr. Robert Lucas3, Dr. Nidhin Raj4, Dr. Charles Clifford1
1National Physical Laboratory, Teddington, United Kingdom. 2AVR Consulting Ltd, Northwich, United Kingdom. 3GlaxoSmithKline Unlimited, Weybridge, United Kingdom. 4GlaxoSmithKline Unlimited, Webridge, United Kingdom

Abstract Text

Excessively oily skin can often cause unwanted skin traits in patients, such as excessive shine, enlarged pores, frequent outbreaks or acne. Comedones are small skin-colored papules frequently found on the T-zone (forehead, nose and chin). Sodium salicylate (NaSal) is an ingredient commonly used in anti-inflammatory drugs, anti-bacterial agents, anti-blemish and anti-aging cosmetic products. Although the exact mechanism of NaSal on comedones is not fully understood at present, it appears to exhibit a significant exfoliation effect on the skin after repeated use. Recent advances in metrology have led to novel methods being implemented using atomic force microscopy (AFM) to probe the structure of biological samples and materials. Indeed, characterization of the nanomechanical properties of comedones at sub-cellular levels remains key in understanding the dynamic processes of comodone outbreak. Herein, we investigated the physical properties of comedones pre- and post-treatment using 2% NaSal under ambient temperature and humidity. When treating comedones with 2% NaSal, samples appeared significantly softer when compared to their pre-treated measurements. Furthermore, the force-volume maps generated, showed that after NaSal treatment, areas in the comedone appeared softer suggesting the beneficial impact of the 2% NaSal solution on loosening the inner content of comedones. Our results provide evidence that NaSal is indeed beneficial as an active ingredient in topical creams aimed at targeting eruptive skin conditions.

Keywords

Atomic force microscopy, force-volume mapping, microcomedones, sodium salicylate and elastic modulus


12:18 - 12:19

100 A comparison of convolutional neural network-based approaches for label-free cell cycle prediction

Elsa Sörman Paulsson, Rickard Sjögren
Sartorius Corporate Research, Umeå, Sweden

Abstract Text

A fundamental aspect of cell biology research is to interrogate cell-cycle dynamics, requiring accurate identification of a given cell’s position within the cell cycle. In microscopic imaging it is standard practice to use fluorescent probes, such as the Fluorescent Ubiquitination-based Cell Cycle Indicator (FUCCI), to create a strong signal of the cell cycle state. Although fluorescent imaging provides a strong signal to help analysis and has been used in countless biological discoveries, there is mounting evidence that fluorescent sensors can alter biological responses stressing the need for label-free approaches. While there are sophisticated label-free imaging technologies facilitating analysis, simple brightfield and phase contrast imaging remains widespread due to being cheap, accessible, and easy-to-use. Thanks to great advances in deep learning-based image analysis driven by convolutional neural networks (CNNs), image analysis-workflows are now more capable than ever before and there are many promising ways of how to determine cell cycle state directly from label-free images.

We compare two different approaches to use CNN-based machine learning to determine cell cycle state directly from label-free 2D phase contrast microscopy-images. Both approaches use fluorescent images to set up ground truth for machine learning-algorithms to learn to predict the corresponding fluorescent readout for future label-free images. One approach is based on first segmenting single cells and then assigning them into discrete categories based on the fluorescent signal and finally train a CNN-classifier to predict the category for future cells. The second approach uses an in-silico labelling (ISL) approach (Christiansen 2018) and train a CNN to predict the corresponding fluorescent image directly from the phase contrast images and thereafter segmenting them and assigning them into categories based on the CNN-predicted fluorescence (Rappez 2020).

In a case study on cell cycle markers, we used a dataset of SK-OV-3, THP-1 and MDA-MB-231 cells labelled with two-color FUCCI. To perform single cell classification, we first performed label-free cell segmentation using a CNN-based instance segmentation model trained on LIVECell, our recently developed cell segmentation dataset (Edlund 2021). We then fine-tuned a CNN-classifier based on ResNet50 and pretrained on ImageNet to classify individual cells assigned to four classes according to their FUCCI expression. In parallel, we trained an ISL CNN, a modified variant of U-net (Ronneberger 2015) that we call OSA-U-net using one-shot aggregation (OSA) and effective Squeeze-and-Excitation blocks (Lee 2020), to minimize the difference between predicted and measured FUCCI fluorescent images as weighted by a smooth L1-loss. We then segmented the cells and assigned them into classes based on the ISL expression. We found that the ISL approach achieved better classification performance compared the classification approach, F1-score of 83.3 and 64 % for the two channels respectively compared to 79.2 and 53.6 % of the classifier. 

The ISL approach not only performed better at cell cycle classification but it also provides less involved configuration compared to the segment-than-classify approach. The classifier performance is directly dependent on the segmentation accuracy as well as the segmentation post-processing. In comparison, the ISL approach only requires phase contrast and fluorescent image pairs and cell segmentation is a completely separate step making it easier to use. To conclude, our ISL-based workflow provides an easy-to-configure method with promising performance for label-free cell cycle detection.

Keywords

Convolutional Neural Networks

Phase Contrast Microscopy

Label-free Image Analysis

Cell Cycle Detection

Deep Learning

References

Christiansen, E. M., Yang, S. J., Ando, D. M., Javaherian, A., Skibinski, G., Lipnick, S., ... & Finkbeiner, S. (2018). In silico labeling: predicting fluorescent labels in unlabeled images. Cell, 173(3), 792-803.

Edlund, C., et al. “LIVECell - A large-scale dataset for label-free live cell segmentation” Nature Methods (in review) (2021)

Rappez, L., Rakhlin, A., Rigopoulos, A., Nikolenko, S., & Alexandrov, T. (2020). DeepCycle reconstructs a cyclic cell cycle trajectory from unsegmented cell images using convolutional neural networks. Molecular systems biology, 16(10), e9474.

Ronneberger, O., Fischer, P., & Brox, T. (2015, October). U-net: Convolutional networks for biomedical image segmentation. In International Conference on Medical image computing and computer-assisted intervention (pp. 234-241). Springer, Cham.

Lee, Y., & Park, J. (2020). Centermask: Real-time anchor-free instance segmentation. In Proceedings of the IEEE/CVF conference on computer vision and pattern recognition (pp. 13906-13915).


12:19 - 12:20

114 Fabrication of functionalized cotton adorned with ZnO nanoflowers for antibacterial activity

Dr. Ambreen Ashar1, Dr. Sadia Noor1, Dr. Zeeshan Ahmad Bhutta2, Mr. Muhammad Shoaib3, Dr. Moazam Ali2
1Department of Chemistry, Government College Women University, Faisalabad, Faisalabad, Pakistan. 2Department of Clinical Medicine and Surgery, University of Agriculture, Faisalabad, Faisalabad, Pakistan. 3Institute of Microbiology, University of Agriculture, Faisalabad, Faisalabad, Pakistan

Abstract Text

Microbial water contamination especially with E. coli, is a main cause of water-borne diseases. Classical techniques being employed to decontaminate water have several limitations that needs replacement with advance treatment technologies such as advance oxidation methods to eliminate pathogen load. In this project , nano-flowers of ZnO have been synthesized by precipitation method  and characterized for crystallinity, morphology and optical properties  by XRD, SEM, TEM,AFM and DRS. The as-synthesized nano-flowers were adhered to pristine cotton by padding and curing. The functionalized cotton was also characterized by SEM and employed for antibacterial activity of nano-flowers. The swatches of 5 cm2 dimension of ZnO @cotton fabric loaded with 20, 42 and 58 µg/ 5 cm2 were cut and dipped in nutrient agar containing inoculum of E. coliThe variable parameters of experiment were time of exposure to UV radiations and artificial sunlight and loading of ZnO nano-flowers onto cotton fabric. The swatches were arranged in triplets on agar plates and incubated for 24 hours before counting the colonies of bacteria The results indicated that colonies of E. coli decreased from 29 x104 /ml to 2x10⁴ /ml CFUs on irradiation with 36 watts of UV 365 nm for 15 min using 58 µg/ 5 cm2 of nano-flowers. On the other hand, these colonies decreased to 1x10⁴ /ml CFU on irradiation with 36 watts of D65 artificial sunlight after 180 min. It can be concluded considering MBC and MIC  that ZnO nano-flowers are capable of exhibiting magnificent bactericidal activity against MDRS E. coli .

Keywords

E. coli; antibacterial; cotton; fabric; ZnO


12:20 - 12:21

133 Robotic microscopy for everyone with the Web of Things: the OpenFlexure Microscope

Dr Richard Bowman1, Dr Joel Collins1, Dr Samuel McDermott2, Mr Joe Knapper1, Mr Boyko Vodenicharski2, Mr Filip Ayazi2, Mr Kaspar Bumke1, Dr Benedict Diederich3,4, Dr Wei Ouyang5, Mr Joram Mduda6, Ms Valeriana Mayagaya6, Mr Paul Nyakyi7, Ms Grace Mwakajinga7, Prof. William Wadsworth1, Mr Valerian Sanga7, Dr Julian Stirling1, Dr Catherine Mkindi6, Prof. Pietro Cicuta2
1Unviersity of Bath, Bath, United Kingdom. 2University of Cambridge, Cambridge, United Kingdom. 3Leibniz Institute of Photonic Technology, Jena, Germany. 4Institute of Physical Chemistry and Abbe Center of Photonics, Friedrich-Schiller-University, Jena, Germany. 5Science for Life Laboratory, School of Engineering Sciences in Chemistry, Biotechnology and Health, KTH - Royal Institute of Technology, Stockholm, Sweden. 6Ifakara Health Institute, Bagamoyo, Tanzania, United Republic of. 7Bongo Tech & Research, Dar es Salaam, Tanzania, United Republic of

Abstract Text

The OpenFlexure Microscope is an open source project that includes hardware and software designs for a well-tested motorised microscope.  Its growing community has built hundreds of microscopes around the world, for applications ranging from prototype diagnostic devices to educational projects. Microscopes have been in service for over a year without failure, and we have refined the design extensively to improve reliability in both assembly and use.  Particular attention has been paid to replicability of both the hardware and the software, and to the prospect of integrating it with other projects in the open microscopy community.

 (left) A rendering of an assembled OpenFlexure Microscope (right) a collection of microscope bodies printed as part of our manufacture and testing at STICLab, Tanzania
Figure 1: (left) A rendering of an assembled OpenFlexure Microscope (right) a collection of microscope bodies printed as part of our manufacture and testing at STICLab, Tanzania

The high resolution version of the OpenFlexure Microscope, intended for laboratory use, comprises a motorised XY stage and motorised focus, a Raspberry Pi camera module, and an optics module based around an RMS-threaded microscope objective.  A tube length correction lens reduces the optical magnification to better match the small size of the Sony IMX219 image sensor, and we take advantage of the tight integration of the Raspbery Pi camera module into the GPU firmware to enable real-time video streaming, fast autofocus, and on-the-fly flat field correction.  This version of the microscope is currently in use in Tanzania, where we are evaluating it for malaria diagnosis.

The OpenFlexure Microscope occupies approximately 150x150x250mm of space, and costs around £200 in parts for the motorised, high resolution version.  This not only makes it extremely accessible and convenient for parallel experiments, but it vastly improves replicability.  Lowering the barrier to reproducing experiments will enable techniques to diffuse more rapidly between labs, as well as the obvious educational and development opportunities it creates.

Our hardware design has now been asembled many times by the core development team, our network of collaborators, and the wider community, including many builders with whom we have had no prior contact.  Our assembly instructions have been refined many times, and we now make use of modern “DevOps” platforms to automatically build printable models and compile our instructions efficiently.  Several variants of the microscope have been developed to enable alternative imaging modes including fluorescence, dark field and digital differential phase contrast, some of which have been integrated into the main project.  More modular optics are possible using the connection to the UC2 system, which integrates our well-tested optomechanical design with a modular optics system that enables rapid reconfigurability and a variety of imaging modes.

Our software architecture is split into a server, handling the core logic and hardware control, and several client applications providing graphical and programming interfaces.  The server and client communicate using an application programming interface (API) that is compliant with the W3C “Web of Things” standard, and uses hypertext transfer protocol (HTTP).  This solves a longstanding problem in open instrumentation control software: how to develop interoperable instruments without forcing a particular framework or programming language on anyone using it.  This approach means that a graphical control interface, a Python module, a MATLAB module, and a web-based debug interface can be used simultaneously, with minimal duplicated code: HTTP requests are part of the standard library for most high-level languages.  The underlying architecture has been separated into its own project, LabThings, and we are working towards interoperability with other open microscopy projects such as uManager and ImJoy.

As we have now deployed microscopes in local clinics in Tanzania, our software includes a dedicated interface to enable patient slides to be scanned in accordance with the study protocol. Splitting the software into a core server component and a number of different clients with different interfaces has been invaluable as we support a community of users with very different levels of computer experience.

Uncaptioned visual
Figure 2: (left) A pane from the OpenFlexure Microscope interface, (right) a composite image of a blood smear, with a single image shown in the inset, reproduced from [1] under CC-BY-4.0.

The core OpenFlexure Microscope project now represents a well tested, fully open design for an automated microscope capable of slide scanning at high resolution (including oil-immersion objectives) and suitable for lengthy unattended experiments.  There are rich prospects for its use in smart microscopy experiments, both as a way to provide easily-replicated implementations of new techniques, and as a low cost platform for parallel experiments.

Keywords

Open source

Open source hardware

Web of Things

Automation

Repeatability

References

  1. Collins J et al. 2020 Robotic microscopy for everyone: the OpenFlexure microscope  Biomedical Optics Express 11 2447-60

  2. Collins J, Knapper J, Stirling J, McDermott S, Ayazi F and Bowman, R 2021 Modern Microscopy with the Web of Things: The OpenFlexureMicroscope Software Stack preprint: https://arxiv.org/pdf/2101.00933.pdf
  3. Diederich et al. 2020 A versatile and customizable low-cost 3D-printed open standard for microscopic imaging Nature Communications 11 5979
  4. Ouyang W et al. 2019 ImJoy: an open-source computational platform for the deep learning era Nat Methods 16, 1199-200
  5. Edelstein A, Tsuchida M, Amodaj N, Pinkard H, Vale RD and Stuurman N 2014, Advanced methods of microscope control using μManager software. Journal of Biological Methods 1(2):e11 
  6. Bowman R, Vodenicharski B, Collins J and Stirling J 2020 Flat-Field and Colour Correction for the Raspberry Pi Camera Module Journal of Open Hardware 4 1
  7. OpenFlexure project website https://openflexure.org/
  8. All relevant source code and design files are available at https://gitlab.com/openflexure/

12:21 - 12:22

175 Lightsheet microscopy for studies of plant-environment interactions

Mr yangminghao liu1, Dr Daniel Patko2,3, Dr Ilonka Engelhardt2,3, Dr Qizhi Yang4, Dr Timothy S George2, Dr Nicola Stanley-Wall1, Dr Vincent Ladmiral4, Dr Bruno Ameduri4, Dr Tim J Daniell2, Dr Nicola Holden5, Dr Michael P MacDonald1, Dr Lionel X Dupuy3
1University of Dundee, Dundee, United Kingdom. 2The James Hutton Institute, Dundee, United Kingdom. 3Department of Conservation of Natural Resources, Bilbao, Spain. 4University of Montpellier, Montpellier, France. 5Scotland's Rural College, Aberdeen, United Kingdom

Abstract Text

Lightsheet microscopy enabled imaging of biological activity. We show a lightsheet microscope system capable of tracking bacterial movements during colonisation of the rhizosphere and of revealing soil chemical changes induced during plant growth. The development of a new generation of environmental microscope could greatly enhance our understanding of biological processes at ecological scale.


Plant growth is supported by many biophysical interactions with microorganisms, geochemicals, water and gas, within the complex soil-atmosphere physical environment. Unfortunately, observations of plants' interactions with both the biotic and abiotic environments are difficult to make at the microscopic scale1–3, as they occur throughout large volumes of influence and natural soils are opaque, creating a severe challenge for conventional microscopy.


A custom-made, multispectral lightsheet microscope was developed to resolve live plant-environment interactions across entire seedlings, in mesocosms comprising a glass chamber of a few cm3 volume and transparent soil. This system was used to track microbial movements and interactions with the soil pore and plant roots using lettuce plants and GFP tagged Bacillus Subtilis. We also demonstrate application of the microscope to measure pH changes during the growth of lettuce plants using newly developed pH sensitive soil. Various image processing and image analysis tools were also developed to quantify including flat field correction, image stitching, and Neural Network models for pH prediction in soil.


The microscope revealed previously unseen patterns of microbial activity in soil. Bacillus Subtilis were shown to favour small pore spaces over the surface of soil particles, colonising the root in a pulsatile manner. the soil pore structure influenced the behaviour of the bacteria, both before and during the formation of biofilms on the root surface something which could not have been observed with experiments run in liquid cultures4-6. Migrations appeared to be directed first towards the root cap before subsequent colonisation of mature epidermis cells. The microscope could also reveal plant-induced acidification of soil particles at the microscopic scale, which far exceed the ability of optochemical sensors currently in use.


When combined with environment sensing transparent soil, lightsheet microscopy enables fast in situ observation of biological process. The study demonstrates an ability to observe both the plant and micro-organisms within their structurally complex environments. Our findings show that microscopes dedicated to live environmental studies present an invaluable tool to understand life in soils


Keywords

lightsheet microscopy, plant-microbe interaction, environmental imaging.

References

1.        Sasse, J., Martinoia, E. & Northen, T. Feed Your Friends: Do Plant Exudates Shape the Root Microbiome? Trends Plant Sci. 23, 25–41 (2018).

2.        Dupuy, L. X. & Silk, W. K. Mechanisms of Early Microbial Establishment on Growing Root Surfaces. Vadose Zo. J. 15, vzj2015.06.0094 (2016).

3.        Deng, J. et al. Synergistic effects of soil microstructure and bacterial EPS on drying rate in emulated soil micromodels. Soil Biol. Biochem. 83, 116–124 (2015).

4.        Massalha, H., Korenblum, E., Malitsky, S., Shapiro, O. H. & Aharoni, A. Live imaging of root–bacteria interactions in a microfluidics setup. Proc. Natl. Acad. Sci. 114, 4549–4554 (2017).

5.        Noirot-Gros, M.-F. et al. Functional Imaging of Microbial Interactions With Tree Roots Using a Microfluidics Setup. Front. Plant Sci. 11, (2020).

6.        Aufrecht, J. A. et al. Quantifying the Spatiotemporal Dynamics of Plant Root Colonization by Beneficial Bacteria in a Microfluidic Habitat. Adv. Biosyst. 2, 1800048 (2018).


12:22 - 12:23

194 Automating Correlative Microscopy with Python: Removing the Frustrations

Mr Thomas Fish, Dr Victoria Beilsten-Edmands, Dr Peter Chang, Dr Maria Harkiolaki
Diamond Light Source, Didcot, United Kingdom

Abstract Text

Summary

Rapid developments in high resolution biological 3D imaging and the budding correlative imaging schemes that harness naturally complementing, but radically different, techniques require the development of a diverse range of in silico protocols to allow their use in an effective and efficient way. At the correlative cryo-imaging beamline at the UK synchrotron, such a pairing of cutting-edge cryo-imaging technologies (including structured illumination fluorescence imaging and soft X-ray tomography) required the development of a rational, step-by-step processing pipeline that can harness the data and metadata from each modality, as well as the correlation of identified regions of interest from samples as they are transferred from one microscope to the next. Data collected from a variety of platforms under different development environments was collated and standardised to allow further analyses and in-depth correlation. Here we present the workflow developed at beamline B24 and the steps that have been taken to streamline data handling, acquisition and analysis and enable the user community to take full advantage of our methods.

Introduction

Major developments in cryo-imaging in recent years have brought about a greater understanding of biological systems through the capture of processes and structures to nanometre resolution. Correlative imaging schemes have now become a necessary next step to allow us to harvest even more information from a given sample, with correlative light and electron microscopy (CLEM) and correlative light and X-ray tomography (CLXT) being the most current developments. At the correlative cryo-imaging beamline, B24, at the UK synchrotron, a new CLXT platform has been developed using two high resolution 3D imaging systems for same sample imaging: (1) cryo-fluorescence Structured Illumination Microscopy (cryo-SIM), which provides 3D localisation of chemical information within cells, and (2) cryo-Soft X-ray Tomography (cryo-SXT), which uses the natural absorption contrast of vitrified biological mater to deliver high resolution 3D data on cells and their internal architecture.

A typical sample at beamline B24 presents as a population of cells or other biological structures supported by a perforated carbon film which is attached to a 3mm gold EM grid. The sample is kept at liquid nitrogen temperatures at all times and data is collected on cells that reside in the gaps between the metal bars that comprise the grid pattern (commonly decorated with positional markers to aid image alignment and relocation of regions of interest). The data acquisition workflow at the beamline for such a sample includes: (a) mapping of the grid surface using diffraction limited bright light and fluorescence cryo-imaging to evaluate sample suitability; (b) at the SIM microscope: white light 2D mapping of the sample followed by imaging (brightfield and fluorescence) to extract super-resolution fluorescence localisation and feature capture at regions of interest, which is followed by data reconstruction and wavelength alignment; (c) at the SXT microscope: white light 2D mapping of the sample and localisation of previously identified regions of interest before X-ray light 2D mapping and SXT data collection in those areas, which is followed by data processing and reconstruction.

There were essentially three major challenges in bringing together these microscopes as far as data acquisition and management were concerned. First, for each sample, positional information needed to be captured and relayed to allow data collection in the same areas in each microscope. Second, each output needed to contain sufficient and accurate metadata that was readable by all conventional and non-commercial reconstruction and imaging software to make it truly accessible and amenable to further data correlation and analyses. Third data processing should be archived and reconstructed with the least amount of user-feedback to ensure data fidelity and method usability. 

Methods

At Diamond Light Source beamline B24, a bespoke biological imaging platform has been developed offering SIM in conjunction to SXT. 

Both primary imaging modalities at B24 became a part of this correlative platform with pre-existing set of variables that defined it. SIM data is collected through Python-based Cockpit, which delivers MRC image stacks for both 2D mosaics (which are accompanied by relative positional information) and 3D volumes. The microscope and control software were developed by an academic institution (Micron), which resulted in a tailored, highly adaptable environment that required further standardisation. SXT data is collected using a proprietary software (Zeiss XRMDataExplorer) that saves data in OLE type files. These are data-rich files but aren’t readable by standard image software.

To provide uninterrupted CLXT data flow at beamline B24 we have developed a workflow that harnesses and harmonises CLXT imaging. Individual components of this linked workflow address distinct requirements each of which bring the beamline one step closer to full automation. Software developed neatly associates with key points in the data flow. These include: (a) StitchM which repackages Cockpit’s 2D mosaic output into OME-TIFF; (b) GridSNAP which automates the 2D correlation of grid mosaics for region of interest relocation between microscopes; (c) XMBatch which uses Zeiss’ API to queue up and automate SXM data collections; (d) txrm2tiff which converts OLE type files into OME-TIFF; (e) DataPath which detects new SXT data, submits it for automated reconstruction and reports progress.

Results

We have produced software to address the challenges that hindered efficient CLXT data collection and processing, from mosaic stitching and sample alignment to data acquisition and reconstruction. We have developed in-house scripts and created freely available software to streamline processes and democratise access to data tools for CLXT users. Our pipeline has delivered a degree of automation that is unprecedented for a CLXT facility but remains constantly under responsive development. As such it acts as an exemplar or the next step of guided automation in correlative imaging. 

Conclusion

Here, we present a unique and fully commissioned correlative microscopy platform that allows the investigation of cell populations at near-physiological condition and to tens of nanometre resolution using both laser and X-ray radiation. While software development is ongoing, these applications are now commissioned and accessible to everyone.

Keywords

X-ray, Tomography, SXT, SIM, cryo, CLXT, Python, automation

References

Kounatidis, I., Stanifer, M. L., Phillips, M. A., Paul-Gilloteaux, P., Heiligenstein, X., Wang, H., Okolo, C. A., Fish, T. M., Spink, M. C., Stuart, D. I., Davis, I., Boulant, S., Grimes, J. M., Dobbie, I. M., & Harkiolaki, M. (2020). 3D Correlative Cryo-Structured Illumination Fluorescence and Soft X-ray Microscopy Elucidates Reovirus Intracellular Release Pathway. Cell, 182(0), 1–16. https://doi.org/10.1016/j.cell.2020.05.051.


Liu, Y., Meirer, F., Williams, P. A., Wang, J., Andrews, J. C., & Pianetta, P. (2012). TXM-Wizard: a program for advanced data collection and evaluation in full-field transmission X-ray microscopy. Journal of synchrotron radiation, 19(Pt 2), 281–287. https://doi.org/10.1107/S0909049511049144


12:23 - 12:24

197 Efficient data annotation for large-scale machine learning-based segmentations with webKnossos

Norman Rzepka
scalable minds GmbH, Potsdam, Germany

Abstract Text

For many machine learning-based segmentation methods, high-quality data annotations remain crucial yet costly to acquire. We report a workflow for Machine Learning-based image analysis projects on large-scale datasets with efficient data annotation. For these workflows, we have developed webKnossos (Boergens et al. 2017), an open-source web-based tool for visualization, annotation, and sharing of large-scale 3D image datasets. webKnossos enables fast exploration of 3D datasets, sized up to petabytes, in the browser. Data can easily be shared between collaborators and annotators via links. webKnossos’ built-in annotation toolbox enables volume labeling, line-segment annotations (aka skeletons), and proof-reading.

In our workflow, training data is generated with the volume labeling tools. An integrated task management system enables distribution among several annotators. With the obtained ground truth data, we can train a neural network model. We can visualize the predictions overlaid onto the raw data using the multi-layer feature. After deriving a segmentation from the model predictions with a watershed algorithm, segments can be visualized as 3D meshes for visual inspection. Errors can be corrected with the proof-reading tools. Next, we evaluate our segmentation. The skeleton annotation tool enables gathering evaluation data (e.g., neuron paths or locations of nuclei). For the case of tracing evaluation neurons in volume electron microscopy (EM) data, we utilize the flight mode of webKnossos, a fast egocentric annotation mode. At all stages, data may be imported and exported for interoperability with other tools.

In my talk, I will focus on the use case of neuron reconstruction from volume EM data. However, webKnossos is well-suited for 3D datasets of multiple modalities including EM, fluorescence microscopy, X-ray CT, and MRI.

https://webknossos.org

Keywords

image segmentation, data annotation, 3d image data

References

Boergens, K., Berning, M. et al. "webKnossos: efficient online 3D data annotation for connectomics". Nat Methods 14, 691–694 (2017). https://doi.org/10.1038/nmeth.4331


12:24 - 12:25

213 Development of a deep neural network based fully automated centrosome analysis workflow

Dr Gabor Pajor1,2, Dr Siegfried Hänselmann3, Dr Barbara Waldkirch3, Dr Rainer Will1, Dr Andreas Plesch3, Prof Alwin Krämer1
1Deutsches Krebsforschungszentrum, Heidelberg, Germany. 2Unversity of Pecs Medical School, Pecs, Hungary. 3MetaSystems, Altlußheim, Germany

Abstract Text

Chromosome instability - a major hallmark of cancer - is very often the consequence of centrosome amplification. Centrosomes are mostly visualized by immunofluorescence microscopy, but precise evaluation is error-prone and featured with inter-personal/-laboratory variance. A diagnostic and high-throughput screening methodology is thus highly desirable. Aim of our study was to develop a novel fully automated fluorescence light microscopy application, being able to determine the proportion of cells carrying aberrant centrosomes per sample. We are combining a deep neural network (DNN) classifier with an automated slide scanning system to generate a workflow that is able to process a large number of centrosome labelled slides with only minimal human interaction. Our project is a work in progress; current summary describes results of the almost finalized DNN to operate within the complete workflow.

MCF10A cells carrying different KRAS point-mutations (resulting in different level of centrosome amplification) were used for primary training of the DNN. Centrosomes were stained using immunofluorescence (antibodies were: CP110/568(red); γ-Tubulin/488(green)); nuclear counterstaining was performed using Hoechst 33342. From five different mutated MCF10A cell lines, 47 slides were stained, from which, more than a hundred and fifty thousand cells (156 699) were manually screened. Out of those, for training the DNN, more than thirty-five thousand (35 610) cells were categorised into seven (7) classes. These were (1) amplified centrosomes in interphase of the cell cycle; (2) amplified centrosomes in M-phase, featuring (pseudo)bipolar mitosis; (3) amplified centrosomes in M-phase, featuring multipolar mitosis; (4) non-amplified (i.e. normal) centrosomes in G1-phase; (5) non-amplified (i.e. normal) centrosomes in G2&S-phases; (6) non-amplified (i.e. normal) centrosomes in M-phase; (7) objects which cannot be classified into any of the above classes. Accordingly, it is also true, that classes 1-3 all belong to the bigger group of ‘amplified centrosomes’ whereas classes 4-6 represent cells with ‘non-amplified centrosomes’. Slides were scanned using Metafer Slide-Scanning System (MetaSystems Hard & Software GmbH, Altlussheim).

Uncaptioned visual

The resulting data set was divided into two non-overlapping subsets (training set and a validation set). The validation set consisted of a random subset of scans, including all images from these scans, such that each cell-class in the validation set contained around 10% of the total number of images of this class. Keras (version 2.2.4) [14] with TensorFlow (version 1.12.0) [15] as backend was used to train a custom convolutional neural net on the training set. In order to increase robustness against image variations and to avoid pure memorization of images, training images were continuously altered using various augmentation techniques such as image flipping, rotation, zooming and the addition of random noise. The training was performed on a single Nvidia Geforce GTX 1070 Ti graphics card.

The DNN has been trained to be able to differentiate between the seven classes, and - in another setting - to be able to differentiate classes 1-3 (amplified centrosomes) from classes 4-6 (non-amplified centrosomes) and class 7. Currently, the DNN’s overall accuracy in predicting all of the classes correctly is 80,5% (Figure 2), whereas its ability to distinguish ‘amplified’ from ‘non-amplified’, is close to 90% (88,3%; Figure 3). The latter result was replicated when already the training of the DNN was done on a pooled data-set (Figure 4.; accuracy: 87,1%).

Further experiments are needed to fine-tune performance of the DNN before integrating it into the automated slide scanning system. This will result in a workflow which fully automatically analyses a sample, assessing the normal to aberrant ratio of centrosomes (including sub-classifying cells according to main cell cycle phases), with the only mandatory user interactions being the initial loading of the slide feeder and the final review of results.

Uncaptioned visual

Figure 2 Total accuracy of DNN - trained to recognize all seven classes (DNN1) - is currently 80,5%

Uncaptioned visual

Figure 3 Total accuracy of DNN1 to distinguish amplified centrosomes from non-amplified centrosomes is currently 88,3%

Uncaptioned visual

Figure 4 Total accuracy of DNN - trained with only three classes (DNN2) - is currently 87,1%


Keywords

centrosome, automated microscopy, deep neural network, DNN

References


12:25 - 12:26

215 Accuracy of mass measurements by AFM

Hans Gunstheimer1,2, Laura Gonzalez1,3, Gabriel König1, Gotthold Fläschner3, Daniel Müller3, Patrick Frederix1
1Nanosurf AG, Liestal, Switzerland. 2TU Ilmenau, Ilmenau, Germany. 3ETH Zurich, Basel, Switzerland

Abstract Text

In this presentation we will discuss cell mass measurements by AFM, their accuracy as well as the influence of the mass position.

The mass of a cell is a fundamental measure of cells and dysregulation of the mass and mass development of cells can be related to many diseases (1). To relate the mass of the cell to its condition it is favorable to combine it with other techniques. Correlative mass measurements and optical microscopy is one obvious possibility, but also the combination with mechanical properties like adhesion or elasticity are of interest. Mass measurements by AFM fulfill these boundary conditions. It has been shown by this method that the cell mass fluctuates and increases over time for healthy cells (2). In contrast, virus-infected cells stop growing and energy depletion or blockage of water channels reduces cell mass fluctuations.

The mass measurement with an AFM is based on the drop in the cantilever’s resonance frequency when a mass is attached to it. Interestingly, this method reveals the cell’s total mass, including the contained water inside the cell rather than the buoyant mass, even with the cantilever immersed in water. In principle, the resonance frequency can be detected using the thermal spectrum of the cantilever, yet this limiting the accuracy and time resolution, particularly for stiff cantilevers. When the cantilever is directly actuated by photothermal excitation the frequency spectrum can be obtained with less noise and in combination with a phase-locked loop the resonance frequency can be tracked with millisecond resolution. The frequency drop not only depends on the mass, but also on the position of the mass on the cantilever. The position can be determined optically but this method is limited by the optical resolution of the microscope and even more so the difficult imaging conditions for low contrast cells on a cantilever. An alternative approach for the position determination uses multimode excitation of the cantilever at its normal modes using the Rayleigh-Ritz method (3).

To determine the accuracy of this picobalance, particles of different sizes and densities were attached to a FluidFM® probe. The measured mass related well to the expected mass with an even narrower distribution than that derived the manufacturer specifications. The derived position by multimode excitation fitted the position of the suction nozzle of the FluidFM probe closely. 

From the obtained results we conclude that the presented technology can be reliably used to measure the mass of cells and changes therein. Furthermore, the first results multimodal excitation of the cantilever seems a promising approach for automated determination of the position of the cell on the cantilever.

Uncaptioned visual

Schematic of AFM setup to measure the mass of cells attached to a cantilever

Uncaptioned visual

Colloidal particle attached to the opening of a tipless FluidFM micropipette with 8 µm opening

Uncaptioned visual

Measured mass versus expected mass. Every point represents the measurement of at least 25 particles.

Uncaptioned visual

Mass and position determination by multimodal excitation. Every curve shows the combinations of mass and position explaining the observed frequency shift for the first three modes. The intersection point (arrow) corresponds to the mass and position of the attached particle. The maxima of the curves are singularities located at oscillation nodes.


Keywords

AFM, cantilever, mass measurement, photothermal excitation, picobalance

References

  1. Lloyd, A. C. Cell 154, 1194 (2013)
  2. Martinez-Martin D. et al. D. Nature, 550, 500 (2017)
  3. Dohn S. et al. Rev. Sci. Instr. 78, 103303 (2007)

12:26 - 12:27

219 Automation of imaging and control of the OpenFlexure Delta Stage using the OpenFlexure MATLAB client.

Dr Samuel McDermott1, Dr Joel Collins2, Mr Filip Ayazi1, Dr Julian Stirling2, Dr Richard Bowman2, Prof Pietro Cicuta1
1University of Cambridge, Cambridge, United Kingdom. 2University of Bath, Bath, United Kingdom

Abstract Text

The OpenFlexure Delta Stage microscope is a low-cost 3D-printed microscope, developed as a fully open-source project1. It is a variant of the OpenFlexure Microscope2. The OpenFlexure Delta Stage is a fully motorised microscope, uses a Raspberry Pi Camera for imaging, and is controlled using a Raspberry Pi. Its small size and low cost make it suitable for use on laboratory benches or in microbiological safety cabinets (MSCs). A MATLAB client has been developed which allows the OpenFlexure Delta Stage to be controlled from within a MATLAB session.  These MATLAB classes can control the position of the stage, change the illumination and return images and videos in MATLAB native formats. This allows researchers to run automated experiments, including over several OpenFlexure Delta Stages simultaneously.

Uncaptioned visual

Figure 1: The OpenFlexure Delta Stage is a bench top microscope suitable for automated experiments. 

The main body of the OpenFlexure Delta Stage (Figure 1) is a single, 3D-printed plastic flexure mechanism which can move the sample in three dimensions.  It is actuated using three stepper motors. The optics module uses a Raspberry Pi camera v2 as the detector in an inverted microscope configuration. The illumination for transmitted light can be a simple white LED all the way to an addressable RGB LED grid.   At the core of the Delta Stage is a Raspberry Pi, which controls these components.  Loaded on the Raspberry Pi, the OpenFlexure Software is coded in Python and the Flask web application framework3.  This controls the lower-level functionality of the microscope (for example sending commands to the motors and capturing images using the camera) and starts a web server, serving web APIs based on the W3C Web of Things interaction model4. This model defines properties, actions and events on the microscope which are mapped to HTTP URLs. The core functionality of the microscope is built into this API, and additional functionality (such as video recording) can be added with extensions, with their own API URLs5.

Because the OpenFlexure Software uses RESTful APIs, which are widely used across internet services6, it is possible to control the Delta Stage using HTTP requests from a variety of existing standard libraries. This work demonstrates this functionality using MATLAB. We have developed the OpenFlexure MATLAB Client7 to enable researchers to perform automated imaging experiments seamlessly. Many students and researchers are familiar with MATLAB, and its image and video analysis tools make it powerful software for automated microscopy. This server-client architecture also means that one client can control several microscopes, by establishing connections to their independent IP addresses. Following the OpenFlexure ethos, the code is fully open source.

To use the client, users download the files from the MathWorks File Exchange8 and add them to the MATLAB path. The set of classes and functions in these files abstract the complexity of creating HTTP requests away from the end user, allowing them to use intuitive native MATLAB functions and data structures. A few examples of the MATLAB commands are given in Table 1.

Uncaptioned visual

Table 1: Example commands for controlling the OpenFlexure Delta Stage from a MATLAB script.

Uncaptioned visual

Figure 2: The MATLAB client runs on any computer with a MATLAB installation. It can control several OpenFlexure Delta Stages via HTTP commands. 

As illustrated in Figure 2, the MATLAB OFMClient class contains core functions for operating the microscope.  These functions convert the MATLAB native data structures into HTTP requests and send the payload to the API URLs.  When a response has been received from the microscope server, they convert the response into the correct MATLAB data structure. The classes and functions are fully documented using the MATLAB help functionality.

If the microscope server has extensions installed, then their API URLs are separate to the core function URLs. However, when the MATLAB Client first connects to the Delta Stage, it requests a list of extensions installed on the microscope, and their associated API URLs. Users can then use their extensions directly from MATLAB in the same way as the core API.

To demonstrate the potential of the OpenFlexure MATLAB client, we use an example of Differential Dynamic Microscopy (DDM)9. This video analysis technique uses a video captured by a microscope to calculate the dynamic properties of colloids in soft materials, or biological objects such as bacteria and cells. It is an automated technique that does not require any user-setting of parameters. To conduct this experiment, the user prepares a sample of colloids of unknown size suspended in a known fluid. The sample is loaded into the Delta Stage. The user starts MATLAB on their computer and connects the microscope to the computer with Wi-Fi or an ethernet cable. The user establishes the connection to the microscope using the MATLAB client classes and a preview video from the camera can then be shown. The user's script can command the microscope's stage to move to a position and run the auto-focus routine. The command can be sent from the MATLAB script to record a video of a certain length with a desired framerate. Once the video has finished recording, it is automatically sent back to the user's computer. The MATLAB script can then analyse the video using the DDM technique and calculate the colloid's size based on their dynamic properties.

As both the video acquisition and analysis are now automated from a single MATLAB script, more complicated experiments can be performed. The video acquisition could occur over several time intervals, for example to measure the relaxation time of non-Newtonian fluids. The script could move the stage to different positions, and videos could be recorded at the boundaries and centre of the fluid. For high throughput, parallelized biological experiments, it is possible to control several OpenFlexure Delta Stages from a single MATLAB script.

The OpenFlexure MATLAB client transforms the OpenFlexure Delta Stage into an automatable device suitable for complex experiments. Its small size means that it can be kept on a laboratory bench or in an MSC, whilst its low manufacturing cost means that it opens automated microscopy to labs all over the world.

Keywords

microscope, 3D printed, open source, MATLAB, automation, dynamic differential microscopy

References

  1. openflexure-delta-stage [Repository], 2021. [Online]. Available: https://gitlab.com/openflexure/openflexure-delta-stage.
  2. J. T. Collins, J. Knapper, J. Stirling, J. Mduda, C. Mkindi, V. Mayagaya, G. A. Mwakajinga, P. T. Nyakyi, V. L. Sanga, D. Carbery, L. White, S. Dale, Z. Jieh Lim, J. J. Baumberg, P. Cicuta, S. McDermott, B. Vodenicharski, and R. Bowman, “Robotic microscopy for everyone: the OpenFlexure microscope,” Biomedical Optics Express, vol. 11, no. 5, p. 2447, 2020.
  3. J. T. Collins, J. Knapper, J. Stirling, S. McDermott, and R. Bowman, “Modern Microscopy with the Web of Things: The OpenFlexure Microscope Software Stack,” 2021. [Online]. Available: http://arxiv.org/abs/2101.00933.
  4. M. Kovatsch, R. Matsukura, M. Lagally, T. Kawaguchi, K. Toumura, and K. Kajimoto, Web of Things (WoT) Architecture, 2020. [Online]. Available: https://www.w3.org/TR/2020/REC-wot-architecture-20200409/.
  5. microscope-extensions [Repository], 2021. [Online]. Available: https://gitlab.com/openflexure/microscope-extensions.
  6. A. Neumann, N. Laranjeiro, and J. Bernardino, “An Analysis of Public REST Web Service APIs,” IEEE Transactions on Services Computing, vol. 1374, no. c, pp. 1–14, 2018.
  7. OpenFlexure Microscope MATLAB Client toolbox [Repository], 2021. [Online]. Available: https://gitlab.com/openflexure/openflexure-microscope-matlab-client.
  8. OpenFlexure Microscope MATLAB Client, 2021. [Online]. Available: https://uk.mathworks.com/matlabcentral/fileexchange/86478-openflexure-microscope-matlab-client.
  9. R. Cerbino and V. Trappe, “Differential dynamic microscopy: Probing wave vector dependent dynamics with a microscope,” Physical Review Letters, vol. 100, no. 18, pp. 1–4, 2008.

12:27 - 12:28

221 Improving the resolution of light sheet microscopy without additional photons

James Manton1, Jan Becker2, Nicholas Barry1
1MRC Laboratory of Molecular Biology, Cambridge, United Kingdom. 2Leibniz Institute of Photonic Technology, Jena, Germany

Abstract Text

Light sheet microscopy reduced photodamage and increases optical sectioning from the levels of wide-field microscopy by illuminating the sample with a thin sheet of light constrained to the vicinity of the focal plane. However, increasing the axial resolution and optical sectioning beyond the levels of spinning disk confocal microscopy is difficult due to the limitations on sheet thickness and smoothness imposed by diffraction.

Bessel beams have been demonstrated to improve axial resolution above the levels possible with comparable Gaussian beams, but must be used with techniques such as structured illumination or multiphoton excitation to remove the deleterious effects of their pronounced sidelobes. As such, additional photons must be used to illuminate the sample, increasing photodamage.

Here, we show how additional axial resolution can be extracted from Bessel beams without additional photons. Through simulations and experiments, we demonstrate the production of images that are sharper, clearer and more amenable to deconvolution. Using a home-built field synthesis light sheet microscope, we show that our method is compatible with both fixed and live cell imaging and independent of fluorophore choice.

Keywords

light sheet, resolution, 3D, volumetric, SNR, PSF, MTF, OTF, image processing, deconvolution


12:28 - 12:29

238 Mapping optical near-field hotspots with multiphoton microscopy in nano/meta- and 2D materials

Prof. Ventsislav Valev
University of Bath, Bath, United Kingdom

Abstract Text

We demonstrate that multiphoton microscopy constitutes an important, fast and user-friendly method for visualizing plasmonic hotspots in nano/meta- and 2D materials. Additionally, this type of microscopy can have a significant impact, literally. Imaging of the samples can imprint the plasmonic patterns on the structures’ surface for subsequent study with structural characterization techniques, such as SEM or AFM. Consequently, the plasmonic patterns can be mapped with the resolution of scanning probe techniques.

Although transition metal dichalcogenides (such as WS2, WSe2, MoS2, MoSe2) have emerged as promising two-dimensional (2D) materials for nonlinear optical applications, they are constrained by intrinsically small light-matter interaction length due to (typically) flat-lying geometries. Here, we present the first hyperspectral multiphoton analysis of a 3D network of densely-packed, randomly distributed stacks containing twisted and/or fused 2D nanosheets of WS2 – referred to as “nanomesh”.[1] We map the optical second harmonic generation (SHG) across the three characteristic spectral features (A, B and C) and we establish the 2-photon luminescence and third harmonic generation signatures. We reveal that the nanomesh presents very different and enhanced multiphoton spectral signatures from those of flat-lying WS2 multilayers. We pinpoint the origin of these differences to hotspots whose location changes depending on the wavelength of illumination. We attribute the main SHG enhancements to double resonances due to a modified energy landscape by the presence of defects (such as vacancies and their passivated variants, or grain boundaries) that induce intra-bandgap energy levels.

Beyond 2D materials, optical metamaterials are mainly based on surface plasmon resonances – in metallic nanostructures, light can collectively excite surface electron waves. These electron waves have the same frequency as light, but much shorter wavelengths, which allow their manipulation at the nanoscale. We present SHG microscopy images where the origin of the SHG can unambiguously be attributed to maxima of the surface charge density, which in turn depend on the geometry of the structures. Our results suggest that SHG microscopy can be used efficiently for mapping the local field enhancement in nanostructured metamaterials.[2-5]

Moreover, we will show that upon illuminating nanostructures made of nickel or palladium, with femtosecond pulses, the resulting surface plasmon pattern is imprinted on the structures themselves.[6] This imprinting is done through the formation of nanojets, allowing for subsequent imaging with scanning electron microscopy (SEM) or atomic force microscopy (AFM). [7] The imprinting method combines aspects of both imaging and writing techniques. The combination offers a resolution on local field enhancements that can, in principle, be brought down to that of the AFM. 

Keywords

2D materials, transition metal dichalcogenides, second harmonic generation, nonlinear optics, multiphoton spectroscopy, plasmonics, metasurfaces

References

[1] A. W. A. Murphy, Z. Liu, A. V. Gorbach, A. Ilie, V. K. Valev, Laser Photonics Rev. (2021), In press.

[2] V. K. Valev, J. J. Baumberg, B. De Clercq, N. Braz, X. Zheng, E. J. Osley, S. Vandendriessche, M. Hojeij, C. Blejean, J. Mertens, C. G. Biris, V. Volskiy, M. Ameloot, Y. Ekinci, G. A. E. Vandenbosch, P. A. Warburton, V. V. Moshchalkov, N. C. Panoiu, T. Verbiest, Adv. Mater. 26, 4074-4081 (2014).

[3] V.K. Valev, N. Smisdom, A.V. Silhanek, B. De Clercq, W. Gillijns, M. Ameloot, V.V. Moshchalkov, T. Verbiest, Nano Lett. 9, 3945 (2009).

[4] V. K. Valev, A. Volodin, A. V. Silhanek, W. Gillijns, B. De Clercq, Y. Jeyaram, H. Paddubrouskaya, C. G. Biris, N. C. Panoiu, O. A. Aktsipetrov, M. Ameloot, V. V. Moshchalkov, T. Verbiest, ACS Nano 5, 91-96, (2010).

[5] V. K. Valev, B. De Clercq, C. G. Biris, X. Zheng, S. Vandendriessche, M. Hojeij, D. Denkova, Y. Jeyaram, N. C. Panoiu, Y. Ekinci, A. V. Silhanek, V. Volskiy, G. A. E. Vandenbosch, M. Ameloot, V. V. Moshchalkov, T. Verbiest, Adv. Mater. 24, OP208-OP215 (2012).

[6] V. K. Valev, D. Denkova, X. Zheng, A. I. Kuznetsov, C. Reinhardt, B. N. Chichkov, G. Tsutsumanova, E.J. Osley, V. Petkov, B. De Clercq, A. V. Silhanek, Y. Jeyaram, V. Volskiy, P. A. Warburton, G. A. E. Vandenbosch, S. Russev, O. A. Aktsipetrov, M. Ameloot, V. V. Moshchalkov, T. Verbiest, Adv. Mater. 24, OP29-OP35 (2012).

[7] V. K. Valev, A. V. Silhanek, Y. Jeyaram, D. Denkova, B. De Clercq, V. Petkov, X. Zheng, V. Volskiy, W. Gillijns, G. A. E. Vandenbosch, O. A. Aktsipetrov, M. Ameloot, V. V. Moshchalkov and T. Verbiest, Phys. Rev. Lett.106, 226803 (2011).


12:29 - 12:30

244 SmartSamplingTM: a revolution in Raman imaging

Dr Thibault Brulé1, Sebastien Laden2, Dr Catalina David2, Ludivine Fromentoux1
1HORIBA France SAS, Palaiseau, France. 2HORIBA France SAS, Loos, France

Abstract Text

From its beginning more than 50 years ago, Raman microscopy has gone through many stages that have marked its history. Starting from spectral acquisitions at from micron sized locations, the capability to acquire Raman images opened the door to more and more applications. Then, the ability of multichannel detectors to acquire spectral data simultaneously improved measurement speed and so increased the performance of such Raman imaging systems allowing acquisition times of less than a millisecond per spectrum. However, such performance is only possible on highly Raman scattering samples, reducing the range of applicable applications.

That’s why we have developed a new approach that improves the speed of Raman imaging for all applications. Based on the contrast of the video image, this algorithm segments the map area into different sized regions of interest. Consequently, a quick preview Raman image, based on high quality spectra, is obtained in few seconds and then this rough image is improved step by step, detail by detail. Thus, good quality images are obtained after only few minutes, unlike classical point by point mapping which often needs hours or days.

In this presentation, we detail how this approach will revolutionize Raman imaging in all application domains, from physical to life sciences.

Uncaptioned visual

Figure 1: Covallaria cells. (Left) 14 minutes SmartSamplingTM Raman image. (Right) Equivalent point by point image obtained in 14 minutes.

Keywords

Raman microscopy
Ultrafast imaging
Intelligent mapping


12:30 - 12:31

245 ContactJ: Lipid Droplets-Mitochondria Contacts measurement by Fluorescence Microscopy and Image Analysis

Gemma Martin1, Marta Bosch2,3, Elisenda Coll1, Albert Pol2,3,4, Maria Calvo1,2
1Advanced Optical Microscopy Facility. Scientific and Technological Centers. University of Barcelona, Barcelona, Spain. 2Department of Biomedical Sciences, Faculty of Medicine, Universitat de Barcelona, Barcelona, Spain. 3Cell Compartments and Signaling Group, Institut d'Investigacions Biomèdiques August Pi i Sunyer (IDIBAPS), Barcelona, Spain. 4Institució Catalana de Recerca i Estudis Avançats (ICREA), Barcelona, Spain

Abstract Text

Lipid droplets (LDs) are the major lipid storage organelles of eukaryotic cells and together with mitochondria key regulators of cell’s bioenergetics. In order to achieve their functions, LDs communicate with mitochondria and other organelles forming membrane contact sites1, “metabolic synapses”, to ensure that lipid provision occurs where and when necessary2–4. Whereas Electron Microscopy allows accurate and precise characterization of contacts, their analysis on a large number of cells and conditions can become a long-term process. On the other hand, confocal fluorescence microscopy combined with advanced image analysis methods enable to extend contact analysis to hundreds of cells and multiple conditions. 

In the present work, we describe a novel and straight image analysis method3 to identify and quantify contact regions between LD and mitochondria in fluorescence microscopy images allowing the automatic analysis of hundreds of cells and multiple conditions. We have developed ContactJ, a macro script for the open-source image analysis software ImageJ5,6. This image analysis workflow combines colocalization7 and skeletonization methods, enabling the detection of LD-Mitochondria contacts together with a complete characterization of organelles and cellular parameters (morphometry and distribution). The correlation and normalization of these parameters contribute to the complex description of cells response under different experimental conditions such as metabolic or pathogenic states. The macro automatically detects and measures LD-mitochondria linear contacts by combining standard and machine learning8 segmentation processes and the novel use of colocalization7 together with skeletonization methods from a large number of fluorescence images. Finally, along the execution of the macro all the data is stored in arrays (cell, LD and mitochondria areas and perimeters, contact perimeter, number of contacts, etc). Moreover, this data is stored in a .txt database file allowing the traceability of the results for each cell and each image.

The described image analysis workflow unveils a wide range of possibilities in the automatic quantification of LD and mitochondria contacts. Obtaining contact regions together with multiple cell and organelles parameters allow building descriptive statistics of the cells response. Moreover, its application in a large number of images enables the use of High Content Screening and Analysis, highly increasing the quality and statistical confidence of the results.   


Keywords

Contact sites, Lipid Droplets, Mitochondria, Image Analysis, ImageJ, Fluorescence Microscopy

References

(1)          Parton, R. G.; Bosch, M.; Steiner, B.; Pol, A. Novel Contact Sites between Lipid Droplets, Early Endosomes, and the Endoplasmic Reticulum. Journal of Lipid Research. American Society for Biochemistry and Molecular Biology Inc. November 2020, p 1364. https://doi.org/10.1194/jlr.ILR120000876.

(2)          Schuldiner, M.; Bohnert, M. A Different Kind of Love – Lipid Droplet Contact Sites. Biochimica et Biophysica Acta - Molecular and Cell Biology of Lipids. Elsevier B.V. October 1, 2017, pp 1188–1196. https://doi.org/10.1016/j.bbalip.2017.06.005.

(3)          Bosch, M.; Sánchez-Álvarez, M.; Fajardo, A.; Kapetanovic, R.; Steiner, B.; Dutra, F.; Moreira, L.; López, J. A.; Campo, R.; Marí, M.; Morales-Paytuví, F.; Tort, O.; Gubern, A.; Templin, R. M.; Curson, J. E. B.; Martel, N.; Català, C.; Lozano, F.; Tebar, F.; Enrich, C.; Vázquez, J.; Del Pozo, M. A.; Sweet, M. J.; Bozza, P. T.; Gross, S. P.; Parton, R. G.; Pol, A. Mammalian Lipid Droplets Are Innate Immune Hubs Integrating Cell Metabolism and Host Defense. Science (80-. ). 2020, 370 (6514). https://doi.org/10.1126/science.aay8085.

(4)          Bosch, M.; Parton, R. G.; Pol, A. Lipid Droplets, Bioenergetic Fluxes, and Metabolic Flexibility. Seminars in Cell and Developmental Biology. Elsevier Ltd December 1, 2020, pp 33–46. https://doi.org/10.1016/j.semcdb.2020.02.010.

(5)          Schindelin, J.; Arganda-Carreras, I.; Frise, E.; Kaynig, V.; Longair, M.; Pietzsch, T.; Preibisch, S.; Rueden, C.; Saalfeld, S.; Schmid, B.; Tinevez, J. Y.; White, D. J.; Hartenstein, V.; Eliceiri, K.; Tomancak, P.; Cardona, A. Fiji: An Open-Source Platform for Biological-Image Analysis. Nature Methods. Nat Methods July 2012, pp 676–682. https://doi.org/10.1038/nmeth.2019.

(6)          Schneider, C. A.; Rasband, W. S.; Eliceiri, K. W. NIH Image to ImageJ: 25 Years of Image Analysis. Nature Methods. Nat Methods July 2012, pp 671–675. https://doi.org/10.1038/nmeth.2089.

(7)          Bourdoncle, P. Colocalization Plugin https://imagej.nih.gov/ij/plugins/colocalization.html.

(8)          Arganda-Carreras, I.; Kaynig, V.; Rueden, C.; Eliceiri, K. W.; Schindelin, J.; Cardona, A.; Seung, H. S. Trainable Weka Segmentation: A Machine Learning Tool for Microscopy Pixel Classification. Bioinformatics 2017, 33 (15), 2424–2426. https://doi.org/10.1093/bioinformatics/btx180.


12:31 - 12:32

275 Medical image registration and pixel classification for the study of protein co-localization and morphology heterogeneity in cancer biopsies

Laura Nicolas1,2, Nerea Carvajal3, Dr. Javier Pascau1,2, Dr. Federico Rojo3, Dr Arrate Muñoz-Barrutia1,2
1Departamento de Bioingenieria e Ingenieria Aeroespacial, Universidad Carlos III de Madrid, Leganés, Spain. 2Instituto de Investigación Sanitaria Gregorio Marañon, Madrid, Spain. 3Department of Pathology, CIBERONC, UAM, Fundación Jiménez Díaz University Hospital Health Research Institute, Madrid, Spain

Abstract Text

We present a novel method to assess the variations in morphology protein expression and spatial heterogeneity of tumor biopsies with application in computational pathology. Different antigen stains in each tissue section are combined, applying complex image registration followed by a final pixel classification step, obtaining the exact location of the proteins of interest. Accurate image registration, necessary for the correct assessment of the antigen patterns, is a difficult process in histopathological images for three main reasons: the high number of artifacts due to the complex biopsy preparation, the large image size, and the complexity of the local morphology. Our previously published method [1] manages to accurately register the tissue cuts and segment the positive antigen areas. In this work, we have further proved the robustness of our solution on a new dataset of breast cancer biopsies, adding a quality measure based on the tissue artifacts, including automatic piece-based registration, and introducing segmentation for all kinds of stains. 

Method: 

Our method consists of 4 steps: First, a robust segmentation with object detection, which is then followed by an object-wise registration. The registered images are then subjected to pixel classification for stain segmentation. Finally, the masks for the different stains are used to study morphology variations and protein-colocalization.

The segmentation of the tissue from the background is obtained analyzing L intensity level from the LAB color space histogram. In tumor biopsies, it is common to have two types of tissue sources: surgical biopsies - which include generally one big block of tissue, and needle biopsies, consisting of several slim pieces of tissue. For this reason, our method detects the number of objects in the biopsy in the segmentation mask and decides whether to proceed with the registration as a single block or for each slim piece individually. 

Once the image is segmented, 3 different binary masks are created for each detected object: A simple one that takes the object as a whole mass without taking into account holes and artifacts (Simple mask), a complex one that involves the careful segmentation of all the minute structures (Whole-tissue mask), and a third one that detects artifacts, holes and fat-predominant areas and will be used for registration quality control (No-artifacts mask).

The registration algorithm calculates a transformation T consisting of a robust pre-alignment and a global and a local transformation. The combined transformation T can be expressed as T=TAlign*TGlobal*TLocal. The alignment and global transformation describe the overall motion of the biopsy and are calculated on the first segmentation mask (Simple mask). The local motion involves the alignment of the internal structure of the biopsy and is applied to the second type of mask (Whole-tissue mask). Further refinement is then calculated using the greyscale image of the segmented tissue.  The third mask (No-artifacts mask) is then used to assess the areas where the registration may be faulty (folds, rips, holes, and predominately-fatty areas), obtaining a pixel-wise quality control of the registration step.   

The pixel classification for stain segmentation algorithm is based on the geometry of the different color spaces’ histograms of the images. This algorithm is applied to the already registered images after applying the third mask (No-artifacts mask), thus, obtaining the segmented stains only in those areas that will be useful for the creation of the heterogeneity map. The registered stain masks are used together to form the heterogeneity map.  

Results: 

The final Heterogeneity Map is created from the stains segmented on the registered tissue cuts. Each transformed section is subjected to our pixel classification for stain segmentation algorithm, which results in a binary mask of the areas positive for the antigen. These masks are overlaid over the fixed image of the patient, obtaining a heterogeneity map that shows protein expression throughout the biopsy. The maps show the antigen distribution in each tissue cut with one simple and easily-to-interpret image. The hot spots of these maps would coincide with the aberrant morphology characteristics of stroma and tumor development as annotated by a pathologist (as seen in Fig. 1).  

Conclusion 

The proposed pipeline is robust and, most importantly, automatic and non-supervised. Compared to other segmentation and registration algorithms, our solution yields similar registration results and improved segmentation results without requiring manual annotations nor training, as shown in [1]. The obtained tumor maps provide a helpful visual representation of the intra-tumor environment and heterogeneity of the tissue. By showing the exact location of the stains within the tissue and how different dyes may correlate, this tool presents a new approach to study the tumor microenvironment. Moreover, these maps would aid in assessing tumor biopsies by automatically detecting the stroma of the tumor, identifying interesting areas and slices, or even as a tool to speed up biopsy analysis for cancer diagnosis. This could reduce diagnostic times with more accurate decisions; the use of these maps would be highly beneficial for speeding up and relieving the clogged system by making the whole process more efficient. These maps can also serve as automatic, non-supervised computer-generated input for training deep convolutional neural networks (DCNNs). Nowadays, these methods rely on manual annotations for training, which means they are dependent on the availability of pathologists. With our maps, tumoral areas and normal tissue can instead be automatically segmented and DCNNs can be trained to detect the corresponding structural information in clinical settings automatically. 


Uncaptioned visual


Fig. 1: Process for the creation of the tumor heterogeneity maps for surgical biopsies and needle biopsies. In the output, it can be appreciated how the hotspots of the biopsies’ staining correspond to clinician-annotated areas of morphology aberrations, specifically the stroma surrounding the cluster morphology of the intratumoral space.


Keywords

computational pathology; image registration; antigen segmentation; cancer; smart pathology;  automatic; non-supervised; breast cancer; Quantitative imaging; machine learning; workflow; smart microscopy; software; analysis

References

[1] Nicolás-Sáenz, L.; Guerrero-Aspizua, S.; Pascau, J.; Muñoz-Barrutia, A. Nonlinear Image Registration and Pixel Classification Pipeline for the Study of Tumor Heterogeneity Maps. Entropy 2020, 22, 946. https://doi.org/10.3390/e22090946


12:32 - 12:33

277 High Resolution Imaging and Nanomechanical Properties of Gram-Positive Bacterial Cell Wall Using Atomic Force Microscopy

Mrs. Anaam Alomari, prof Jamie K. Hobbs, Prof Simon J. Foster
Sheffield university, sheffield, United Kingdom

Abstract Text

The past decade has seen the rapid spread of antimicrobial resistance which is a major public health crisis. To reduce the spread of antimicrobial-resistant pathogens, scientists need a greater understanding of their appearance and survival. AFM has the ability to obtain high-resolution images in air or liquid conditions. To better understand the mechanisms in the live cell wall, numerous studies demonstrate a different method to trap live cells in liquid. In this research, we imaged the extracted cell wall of Staphylococcus aureus (sacculi)and investigate how methicillin-resistant Staphylococcus aureus (MRSA) differs from the wild-type. A comparison has been made between the architecture of the cell wall for these two strains and clear differences in thicknesses are observed which depend on both the local age of the cell wall and the hydration state. To further explore the relationship between mechanical properties and cell wall architecture in bacteria we are also studying live cells of Bacillus subtilis. B.subtilis was used of these cells could be more easily immobilised than Staphylococcus aureus during the imaging process. This preliminary study is exploring the different architectures in different positions on the cell wall of the bacteria, such as the division area and the edge of the cell.

Keywords

Gram-Positive Bacterial 

 Nanomechanical Properties 

 Cell Wall 

 Atomic Force Microscopy

methicillin-resistant Staphylococcus aureus


12:33 - 12:34

294 Detection of extracellular vesicles in non-Newtonian fluids using vibrating microcantilevers

Clodomiro Cafolla, Kislon Voitchovsky
Durham University, Durham, United Kingdom

Abstract Text

Extracellular nanovesicles (EVs) are small (30-150 nm) phospholipid-based vesicles present in most, if not all bodily fluids. They are naturally released by cells into the surrounding medium and are used as vehicles to cargo small molecules, proteins and nucleic acids throughout the body. EVs mediate active communication between cells and can help regulate the growth and the fate of adjacent and distant cells [1]. Recently, EVs have drawn considerable attention for their potential in nanomedicine due to the fact that they carry distinct markers (proteins and nucleotides) which concentration may be correlated with diseases such as cancers, diabetes, and neurodegenerative diseases [1, 2]. In the case of cancer, for example, it has been shown that both cancer cells and Tumour MicroEnvironment stromal cells release EVs that promote tumour-induced immune suppression, angiogenesis and metastasis [3]. Aside from promoting tumour proliferation, multiple studies conducted on EVs extracted from cancer patients suggest the existence of distinct markers specific to most types of cancerous tumours [1], suggesting that EVs could be used as an early diagnostic tool, when cancer is most treatable. This would be further facilitated by the fact that EVs collection from liquid biopsies (mainly blood, saliva and urine) is relatively straightforward and minimally invasive compared to surgery.

However, characterising EVs from biopsies remains currently a significant challenge. Quantifying the proteomic and genetic content of the EVs is lengthy (> hours), costly, and typically requires significant quantities of biopsy liquid. This is because the EV sample are obtained by purification and concentration from the biopsies. There are no accepted standards for these crucial steps, and it is not clear whether the process alters the EVs, let alone the subsequent characterisation. This often results in contradictory or confusing findings, leading to difficulties in comparing studies and building a reliable picture. This confusion is best illustrated by the existence of a review paper for every three original publications in the field, with reviews attempting to bridge studies and build a global picture.

There is hence a strong need to develop techniques able to characterise EVs in-situ, directly in raw bodily fluid samples. Ideally such techniques should also be rapid from sample collection to quantitative results, relatively cheap, have inbuilt references, and be able to function on small volumes of fluid. 

Here we test the suitability of using atomic force microscopy (AFM) microcantilevers to quantify a set model EV sub-population exhibiting a specific marker directly inside saliva. Aside from bypassing extraction and purification-related issues, a microcantilever-based approach offers multiple advantages over existing approaches: (i) it uses using small amount of biopsy (<0.1 mL), (ii) it can be multiplexed easily, (iii) it is relatively flexible for functionalisation, and (iv) it can be integrated into microfluidics chips, potentially using self-actuated cantilever to bypass the expensive AFM detection. 

Microcantilevers have long been used for bio-detection with excellent sensitivity [4,5], but usually with the cantilever operated in air or in vapour, but not directly immersed into the fluid of interest. Here we use as a model system AFM microcantilevers functionalised with streptavidin to detect small quantities of synthetic phospholipid vesicles dissolved in raw saliva. 0.5% of the vesicles’ lipids are biotinylated, allowing for strong, irreversible binding to the cantilever’s streptavidin. The main challenge to overcome is the need for the cantilever to achieve reliable dynamic sensing inside a ‘dirty’ non-Newtonian fluid containing biopolymers in suspension while operating for extended periods of time. We show that it is possible to achieve a detection sensitivity better than 1 microgram/ml of vesicles in raw saliva within minutes, limited mainly by the vesicle’s diffusion timescale within the sample. The detection sensitivity can track model EVs at concentrations two orders of magnitude lower than the typical total EV concentration naturally occurring in blood [6]. This suggests microcantilever-based approaches to targeted EVs as a promising route for in-situ detection. 


References

[1] S. Fais, et al. ACS Nano 10 (2016) 3886–3899.

[2] L. J. Vella, et al. Int. J. Mol. Sci. 17, 173 (2016)

[3] J. Armstrong, et al. ACS Nano 11, 69 (2017).

[4] H. P. Lang, M. Hegner, & C. Gerber Materials Today 8 (2005) 30–36. 

[5] T. Braun, et al. Nat Nanotechnol (2009) 179–185.

[6] I. Helwa, et al. PLoS ONE 12 (2017) e0170628.


12:34 - 12:35

313 High-resolution AFM reveals the nanoscale architecture of MRSA cell wall

Abimbola Feyisara Adedeji Olulana1,2, Bohdan Bilyk1,3, Laia Pasquina-Lemonche1,2,4, Katarzyna Wacnik1,3, Xinyue Chen1,2, Simon .J. Foster1,3,4, Jamie .K. Hobbs1,2,4
1Krebs Institute, University of Sheffield, Sheffield, United Kingdom. 2Department of Physics and Astronomy, University of Sheffield, Sheffield, United Kingdom. 3Department of Molecular Biology and Biotechnology, Sheffield, United Kingdom. 4The Florey Institute, University of Sheffield, Sheffield, United Kingdom

Abstract Text

Methicillin-resistant Staphylococcus aureus (MRSA) is a gram-positive bacteria that is genetically-distinct from the antibiotic-sensitive Staphylococcus aureus. Also, MRSA is part of WHO priority group of Superdrug that could lead to 10 million death in the year 20501. So far, the studies performed on resistance in MRSA have focussed on the genetic-mutation and evolution associated with MRSA but little has been done as touching understanding the physics that underpins resistance in MRSA2.   Here are some of the questions that we seek to address; 1) what are the imprints of resistance on the cell wall architecture? 2) Can we distinguish the antimicrobial strains based on the material properties of their associated cell wall? 3) What is the link between the architectural differences and the inherent macroscopic resistance expressed by MRSA? In addition, 4) when the native penicillin-binding proteins are turned off via methicillin treatment, what are the architectural changes observed?

Our goal is to address these questions by using high-resolution atomic force microscopy (AFM) to decipher the associated cell wall, treated and not treated with an antibiotic. We utilized Tapping mode and PeakForce Tapping mode to examine the thickness of the purified sacculi and the 3D molecular architecture associated with the internal and the external surface of MRSA sacculi (extracted cell wall), without and with treatment with antibiotic. In a complementary fashion, we used wide-field fluorescence microscopy to characterize the cell size and cell cycle associated with MRSA cells and other derivatives of S.aureus, with the latter consisting different genetic modifications but within the same genetic background. 

We find that MRSA is associated with thicker cell wall (by approximately 35%) and reduced cell size (by approximately 30%) when compared to other S.aureus derivatives with no and low-level resistance. For the external surface, AFM reveals different subdomain of porous-rich mesh network, with changing depth, and an extra layer of mesh matrix in the Z-direction. In addition, the nascent peptidoglycan structure is characterized by a concentric rings-like structure in the absence of methicillin treatment, but this is replaced with dense but random structure when such cells are treated with methicillin. By studying the impact of antibiotics on cells with mutations in different cell wall synthesis proteins, we are able to gain new insights into which enzymes are responsible for which architectural features in the bacterial cell wall. This work brings us closer to methods for determining the molecular phenotype associated with particular genes, as well as to understanding how MRSA evades antibiotic-induced cell death.


Keywords

High-resolution AFM, peptidoglycan, MRSA, 3D architecture.

References

References

  1. de Kraker MEA, Stewardson AJ, Harbarth S. Will 10 Million People Die a Year due to Antimicrobial Resistance by 2050? PLoS Med. 2016;13(11):1002184. 
  2. Panchal V V., Griffiths C, Mosaei H, et al. Evolving MRSA: High-level β-lactam resistance in Staphylococcus aureus is associated with RNA Polymerase alterations and fine-tuning of gene expression. Peschel A, ed. PLOS Pathog. 2020; 16(7):e1008672. 
  3. Pasquina-Lemonche L, Burns J, Turner RD, et al. The architecture of the Gram-positive bacterial cell wall. Nature. 2020;582(7811):294-297

12:35 - 12:36

314 Single Molecular Dynamic Imaging of DNA-Protein using Atomic Force Microscopy

Mrs Vinny Verma, Prof Jamie Hobbs, Prof Jon Sayers
University of Sheffield, Sheffield, United Kingdom

Abstract Text

Summary

DNA Polymerases are enzymes that help in DNA replication. The enzyme’s Flap Endonuclease or FEN domain is responsible for the removal of the Flap DNA structure formed during DNA replication. AFM allows the imaging of surface topography of soft molecules and can be applied for single molecular imaging of the DNA-Protein interactions. DNA was immobilised on polyornithine treated mica surface and imaged withThermus aquaticus DNA Polymerase I to image and understand the conformation changes that occur when the FEN domain of the DNA Polymerase I interacts with the Flap DNA.

Introduction

The aim of my project is to use single molecular dynamic imaging to understand the interactions between DNA and DNA regulating proteins.

DNA polymerases synthesize the complementary DNA strands from a DNA template. It’s 5’ exonuclease domain (Flap endonuclease), plays an important role in DNA replication, repair and recombination. It is responsible for the removal of 5’ branch on the lagging strand of DNA during replication. Aspects of how FENs locate their branched DNA substrates and the conformational changes associated with DNA hydrolysis remain unclear and progress in this direction could greatly improve the field of medicine and biotechnology.

AFM is a high-resolution imaging technique that enables molecular and sub-molecular
 resolution imaging in liquid environments, allowing biological systems to be visualized at the molecular scale under physiological conditions. AFM can allow us to know how FENs process their substrate and what conformational changes occur during the reaction. Dynamic AFM imaging provides the advantage of allowing imaging in biological conditions, compared to other imaging techniques. Hence, it gives us the opportunity to understand the physical aspects of the FEN catalysed reaction, thus complement the biological information already available.

 Methods and materials

The experimentation included production and purification of Flap DNA, Thermus aquaticus Flap Endonuclease and Thermus aquaticus DNA Polymerase I. For AFM imaging, the DNA molecules were immobilized on polyornithine treated mica surface. Dynamic imaging was performed by Tapping mode AFM in suitable buffer conditions using soft-tippped and flexible cantilevers like AC-40 and Fastscan-D with optimized tapping frequency and amplitude. Meticulous experiments were performed to optimize the conditions of immobilization of the DNA and Protein samples onto the surface for best high-resolution imaging. the protein was added into the imaging buffer meniscus during the dynamic imaging to observe the interactions.

Results and Discussion

The images obtained revealed numerous Y-shaped Flap DNA with a thicker and higher strand (representing the double stranded DNA) and a thinner less-elevated strand attached to it (single stranded flap structure).

The images obtained with the DNA and Protein together show the Taq PolI with inactive FEN domain binding to flap DNA while the flap DNA is cleaved when interacting with the active FEN.


Keywords

dynamic AFM, Protein-DNA interactions


12:36 - 12:37

319 Identification and analysis of ion-implanted chromium dopants in monolayer MoS2

Mr. Michael Hennessy1, Dr. Eoghan O'Connell1, Mr. Manuel Auge2, Mr. Stefan Rost3, Mr. Minh Bui3, Mr. Eoin Moynihan1, Prof. Beata Kardynal3, Prof. Hans Hofsäss2, Prof. Ursel Bangert1
1University of Limerick, Limerick, Ireland. 2Georg-August-Universität Göttingen, Göttingen, Germany. 3Peter Grünberg Institute, Jülich, Germany

Abstract Text

The remarkable physical properties of monolayer thick transition metal dichalcogenides (TMDCs), resulting from their two dimensional (2D) geometry and lattice symmetry, make them an exciting platform for developing photonic devices with new functionalities [1]. Monolayer TMDCs can be easily incorporated into electrically driven devices, which in turn can be coupled to optical microcavities or photonic circuits [2]In order to make such devices a reality, modification methods tailored for these materials must be developed. Ultra-low energy (10-25 eV) ion implantation  [3,4] of monolayer TMDCs is carried out using the ADONIS mass-selected ion beam deposition system at the University of Gottingen [5]This novel technique allows for highly pure, clean and selective substitutional incorporation of dopants [6] and is compatible with standard semiconductor processing. Additionally, post-growth doping [7] of TMDCs offers an expanded selection of possible dopants compared to the popular method of doping via CVD growth.


Here we present results of ultra-low energy ion implantation of chromium into monolayer MoS2Ab initio band structure calculations are first used to analyse the suitability of MoS2 for electronic tailoring via ion implantationAtomic resolution high angle annular dark field (HAADF scanning transmission electron microscopy (STEM), together with core-loss electron energy loss spectroscopy (EELS) analysis, is used to identify individual dopant atoms in the host lattice and examine the atomic structure of the defects and dopants in the monolayers. Strain induced at dopant sites in the lattice is analysed and quantified using 4D-STEM. Analysis of experimental HAADF STEM and 4D-STEM data is carried out using the Temul Toolkit Python library [8], based on Atomap [9]. Low loss EELS is used in conjunction with low temperature photoluminescence to study excitonic behavior at the strained implantation sites.


This work constitutes a proof-of-principle study to incorporate implanted TMDCs into non-classical single photon emitting diodes [10]. The development of such devices has far-reaching implications for emerging technologies such as quantum cryptography and quantum metrology.


The authors gratefully acknowledge funding from Volkswagenstiftung.

Keywords

2D materials, HAADF STEM, EELS, ion implantation, semiconductors

References


[1]    K. Mak, C. Lee, J. Hone, J. Shan, and T. Heinz, Phys. Rev. Lett. 105, 136805 (2010). 

[2]    K. Mak and J. Shan, Nat. Photonics 10, 216 (2016). 

[3]    K. Dolui, I. Rungger, C. Das Pemmaraju, and S. Sanvito, 1 (2013). 

[4]    V. P. Pham and G. Y. Yeom, Adv. Mater. 28, 9024 (2016). 

[5]    M. Uhrmacher and H. Hofsäss, Nucl. Instruments Methods Phys. Res. Sect. B Beam Interact. with Mater. Atoms 240, 48 (2005). 

[6]    J. W. Mayer, 1973 Int. Electron Devices Meet. 3 (1973). 

[7]    A. Azcatl, X. Qin, A. Prakash, C. Zhang, L. Cheng, Q. Wang, N. Lu, M. J. Kim, J. Kim, K. Cho, R. Addou, C. L. Hinkle, J. Appenzeller, and R. M. Wallace, ArXiv In Press, 1 (2016). 

[8]    E. O’Connell, M. Hennessy and E. Moynihan, PinkShnack/TEMUL: DOI Release. https://doi.org/10.5281/ZENODO.3832143 (2020). 

[9]    M. Nord, P. E. Vullum, I. MacLaren, T. Tybell, and R. Holmestad, Adv. Struct. Chem. Imaging 3, 9 (2017). 

[10]    M. D. Eisaman, J. Fan, A. Migdall, Acta Med. Okayama 67, 259 (2013). 


12:38 - 12:39

437 High Resolution Large Field of View Axial Swept Lightsheet Microscope at Low Cost

Ben Sutcliffe1, James Manton1, Jerome Boulanger1, Adam Fowle2, Ryan Usher3, Dave Cattermole3, Martin Kyte3, Andy Howe3, Tom Pratt4, Nick Barry4
1Light Microscopy Facility, MRC Laboratory of Molecular Bilology, Cambridge, United Kingdom. 2Technical Instrumentation Workshop, MRC Laboratory of Molecular Biology, Cambridge, United Kingdom. 3Electronics Workshop, MRC Laboratory of Molecular Biology, Cambridge, United Kingdom. 4IT Department, MRC Laboratory of Molecular Biology, Cambridge, United Kingdom

Abstract Text

Live imaging is always a compromise, scientists are invariably sacrificing brightness of the signal for imaging duration. Many scientists gravitate towards a confocal microscope for live imaging; however, these systems are inherently slow and, perhaps more importantly, impart a high light dose on a sample. This often results in cell death being imaged rather than the biological process of interest. On the other hand, widefield systems are faster, but lack the ability to optically section the sample and larger specimens suffer from out of focus light resulting in image blur. An elegant solution to this is to use a Lightsheet microscope. Lightsheet microscopes have fast full frame capture on a camera and retain the ability to optical section the sample. At the LMB more scientists are performing live imaging of samples larger than single cells therefore we set out to build a Lightsheet microscope capable of higher resolution than commercial systems over a large field of view at a fraction of the cost. The system needs to be capable of imaging medium sized samples over time (spheroids, organoids, Drosophila embryos, etc) from multiple angles with sample incubation control. This must all to fit into a small footprint system and be controlled with open-source software. Here we present our new custom Axial Swept Lightsheet Microscope (ASLM) which fits all the requirements stated above and allows the use of a shorter, thinner Lightsheet to achieve higher resolution images.

Keywords

Lightsheet, ASLM, Custom, Organoid, Spheroid, Drosophila,

References