10:00 - 10:30
In the last decade, 3D electron diffraction (3DED)[1] has emerged as a new and highly successful method for ab initio structure solution of Nanosized crystals. With the resolving power of modern Transmission Electron Microscopes (TEM), it is possible to image a single atom. The ability to resolve atomic resolution detail in an image poses a question of electron crystallography which would not be a consideration for X-ray or Neutron crystallography. How many repeating unit cells does it take to be considered a crystal? When is a collection of atoms a particle, and when is it a crystal? Where is the boundary between these two states of matter, is the boundary between them sharp or ill-defined? The International Union of Crystallography definition of a crystal states, “A material is a crystal if it has essentially a sharp diffraction pattern.” [2] We will present a framework to assist in refining the definition of a crystal in the context of a 3DED experiment, determining the minimum requirements to define the particle-crystal transition and propose where the experimental limits of a crystal and, by extension, electron crystallography.
The approach taken has been to build crystal models with increasing numbers of unit cells and calculate their diffraction patterns via multislice software. Analysis of the calculated diffraction patterns provides insight into where the particle-crystal transition occurs and the nature of the transition.
Experimentally observing such tiny crystals requires careful consideration of the electron beam fluence, as too high an electron beam flux could melt the crystal under observation. Most multislice software does not provide the capability to control the electron budget within a simulation; therefore, we have developed this capability via a Monte Carlo approach taking into account the detector characteristics and electron budget of the simulated image. Enabling the simulation of low electron beam current images for a more realistic understanding of the experimental data will help the experimentalist understand signal to noise under limited electron budget experiments, which is a critical factor for beam sensitive materials.
Operating in low beam fluence conditions can be a challenging problem. Therefore, we have developed machine learning algorithms to detect objects within the field of view for low signal to noise and noisy data, which will also be presented.
3DED, structure solution, particle-crystal transition, simulation, machine learning, low signal to noise, electron fluence
10:30 - 10:42
We introduce a Bayesian genetic algorithm for reconstructing atomic models of catalytic nanoparticles from a single projection using Z-contrast imaging. Atom-counting results obtained from annular dark field scanning transmission electron microscopy (ADF STEM) images serve as an input for the initial three-dimensional (3D) model. The novel algorithm minimizes the energy of the structure while exploiting a priori information about the imprecision of the atom-counting results. The results show good prospects for obtaining reliable reconstructions from images acquired with lower incident electron doses.
In order to fully exploit structure-property relations of nanomaterials, a 3D characterization at high resolution is often required. In recent years, the resolution of electron tomography has reached the atomic scale. However, many interesting materials are too beam-sensitive to handle the substantial electron dose of the multiple projections required for electron tomography. Therefore, an alternative method has been developed where the 3D atomic structure is reconstructed from atom counts obtained from a single ADF STEM projection image. These atom counts can be used to create an initial atomic model which serves as an input for an energy minimization to obtain a relaxed 3D reconstruction of a nanostructure [1-3].
Two possible approaches for the energy minimization are nowadays available. Using the first approach, the energy is minimized by shifting the atomic columns up and down while keeping the number of atoms in a column fixed to the outcome of the atom-counting procedure [2]. The second approach consists of a full molecular dynamics simulation to relax the particle’s structure [3]. Where the first method is too strict by ignoring atom-counting imprecision, especially at lower doses, the second method runs the risk of ending up in a global energy minimum and violating the physical constraints of the experimental observation. To overcome these limitations, we propose to include the atom-counting imprecision via a Bayesian inference scheme. Moreover, the incorporation of additional prior knowledge from neighbour-mass relations will be beneficial when reconstructing atomic models from low dose ADF STEM images. Genetic algorithms (GA) are powerful tools for solving such large optimization problems [4,5]. Here, our prior knowledge is fused into a new Bayesian GA for reconstructing the 3D atomic structure.
Figures 1(a-b) show the model of the Pt nanoparticle embedded in a carbon support which is used in our simulation study. Figures 1(c-d) illustrate simulated ADF STEM images for 2 different electron doses. By modelling the images as a superposition of Gaussian peaks located at the atomic columns, the volume under each peak can be estimated by fitting this model to the region of interest. These volumes are integrated intensities of electrons and thus correspond to scattering cross-sections. In a subsequent analysis, the distribution of the scattering cross-sections of all atomic columns is decomposed into overlapping normal distributions as illustrated in Figures 1(e-f) [6]. The number of atoms in each projected atomic column is then obtained by assigning the scattering cross-section to the component that generates this scattering cross-section with the highest probability. The width of the distributions in Figures 1(e-f) reflects the imprecision on the atom-counting results and can be used to define the probability for an atomic column to contain a specific number of atoms (Figures 1(g-h)). This probability is included as a priori information in the energy minimization scheme for the 3D atomic reconstruction of the nanoparticle. In this manner, the removal or addition of an atom to a column is only allowed within the finite precision of the atom-counting result. In addition to the a priori knowledge from the atom-counting imprecision, we include also neighbour-mass relations as further a priori knowledge that abrupt discontinuities are highly non-physical.
In an extensive simulation study, the quality of the obtained reconstructions is quantitatively evaluated in terms of the coordination number of the surface atoms, which are of general interest for catalysis. Figure 2 shows the fraction of the surface atoms with the same coordination number as the ground truth Pt model. As a reference, the results for the reconstructions without prior knowledge are also included. Reconstructed models at different doses and the ground truth model are displayed in Figure 3. From Figures 2 and 3, it is clear that a significant improvement is observed when including more relevant prior knowledge, especially at lower doses.
In conclusion, an advanced Bayesian genetic algorithm to reconstruct 3D atomic models of nanoparticles will be presented with its possibilities and limitations. The method is very promising for obtaining reliable 3D atomic models of beam-sensitive nanoparticles during dynamical processes from images acquired with lower incident electron doses [7].
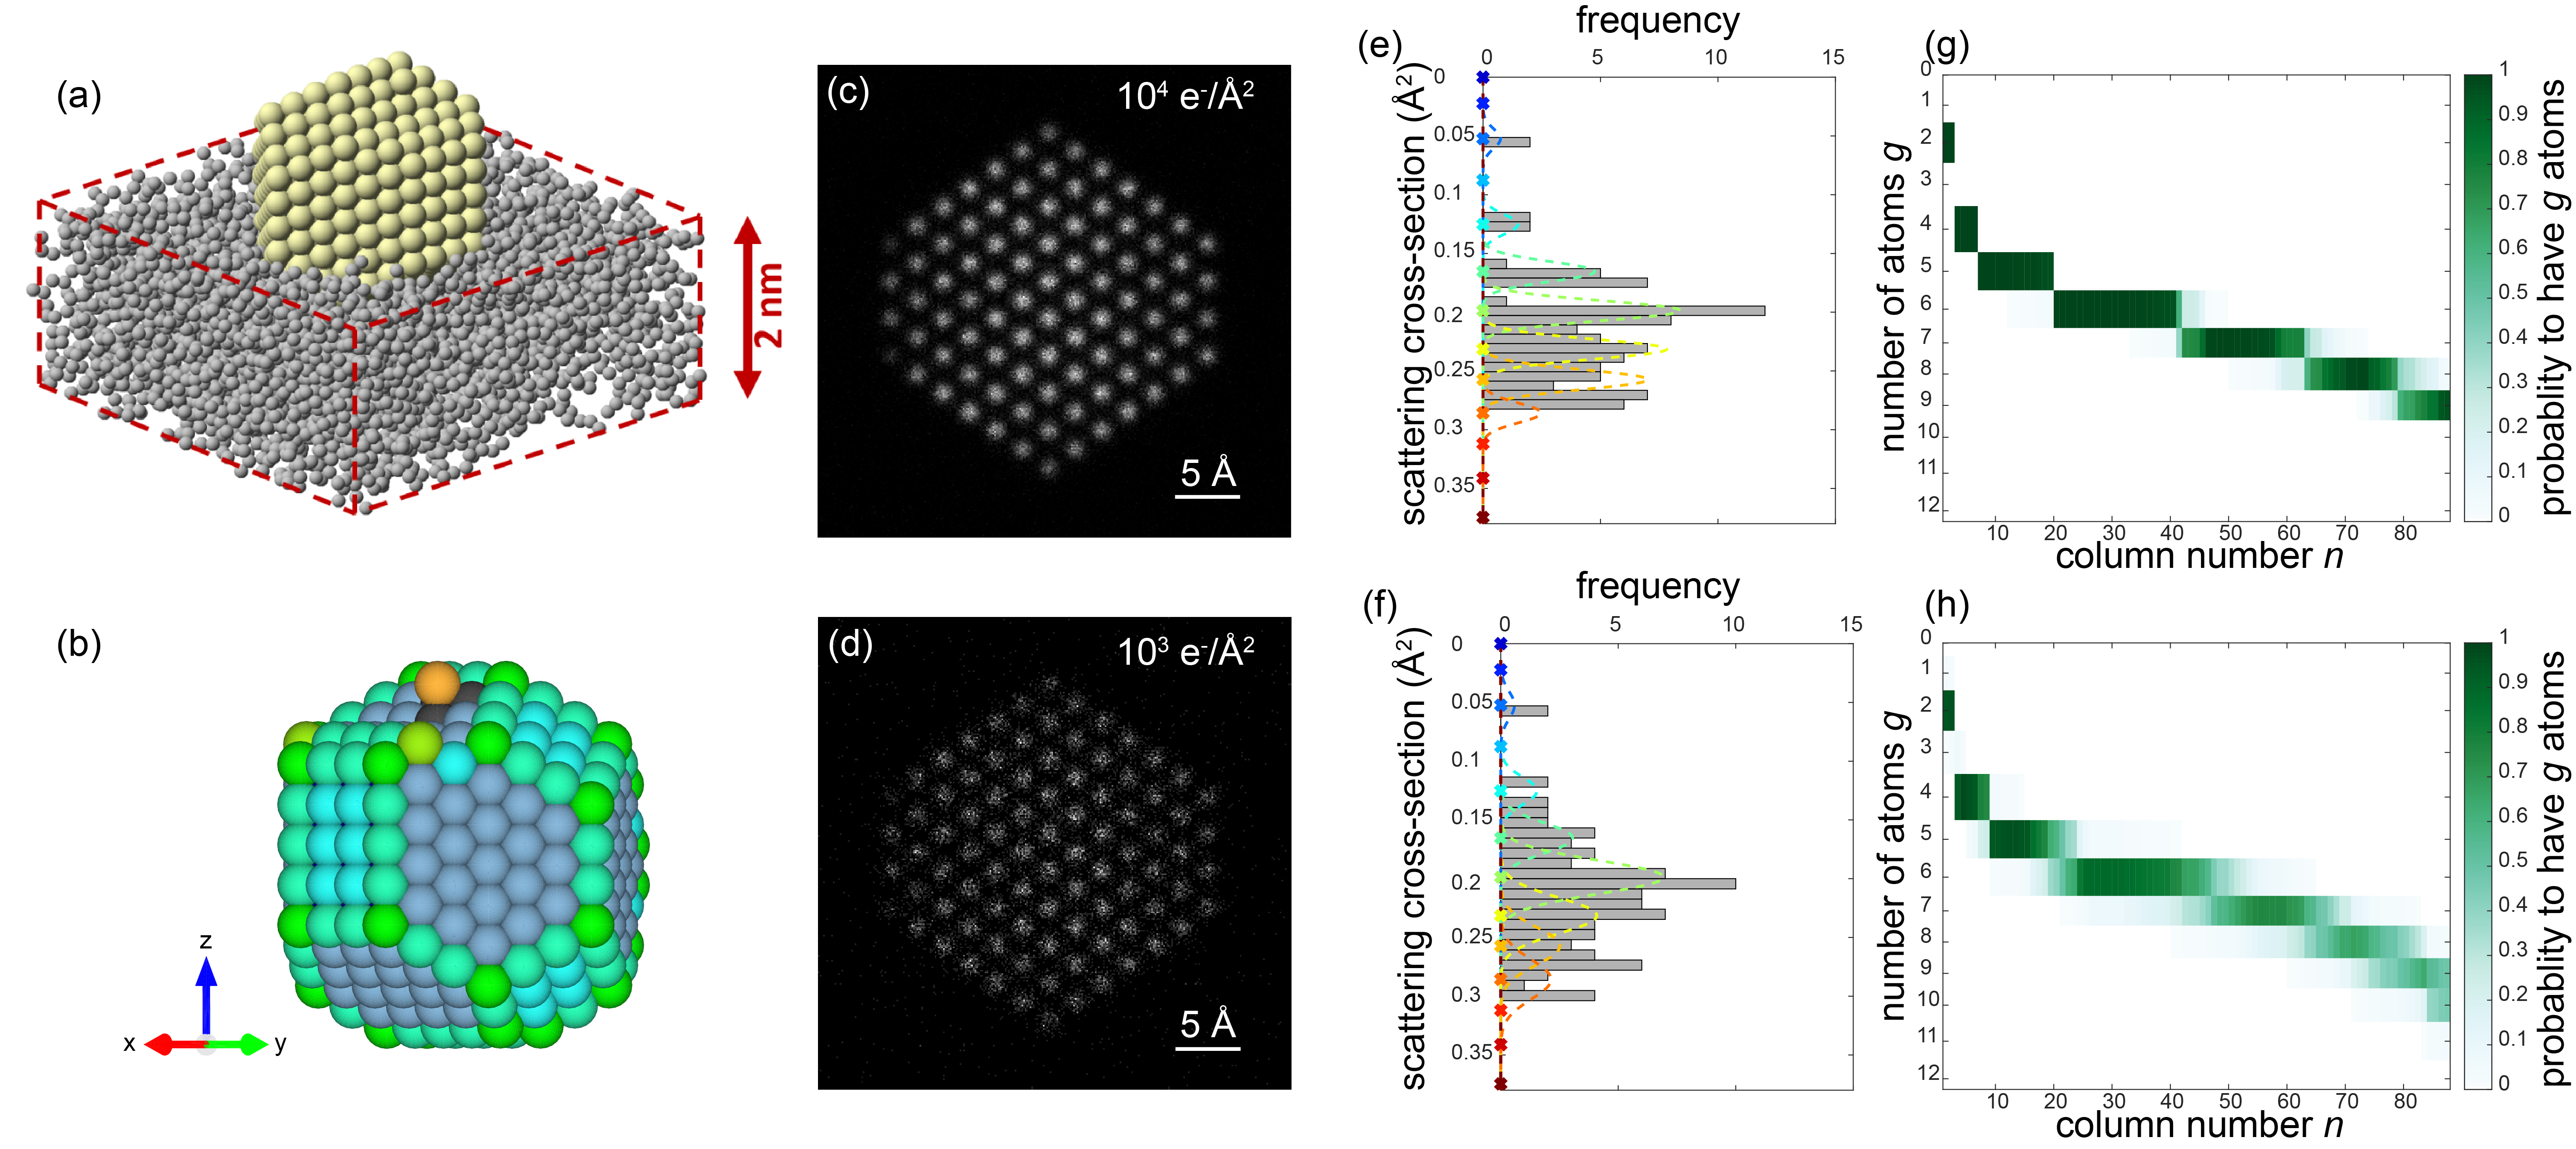
Figure 1 (a) Model for a Pt nanoparticle embedded in the carbon support. (b) Model of the same Pt nanoparticle where the coloring of the Pt atoms indicates the nearest-neighbor coordination. (c-d) Simulated ADF STEM images of the nanoparticle in (a) along the 110 axis for incident electron doses of 104 e-/Å2 and 103 e-/Å2. (e-f) Distribution of the scattering cross-sections for the two incident electron doses of 104 e-/Å2 and 103 e-/Å2 (g-h) corresponding probabilities for a column n to contain a specific number of atoms g.
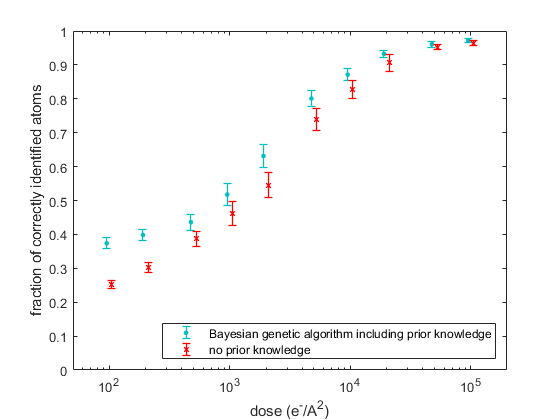
Figure 2 Fraction of the correctly identified surface atoms with the same coordination number as the ground truth Pt model as a function of the incident electron dose.
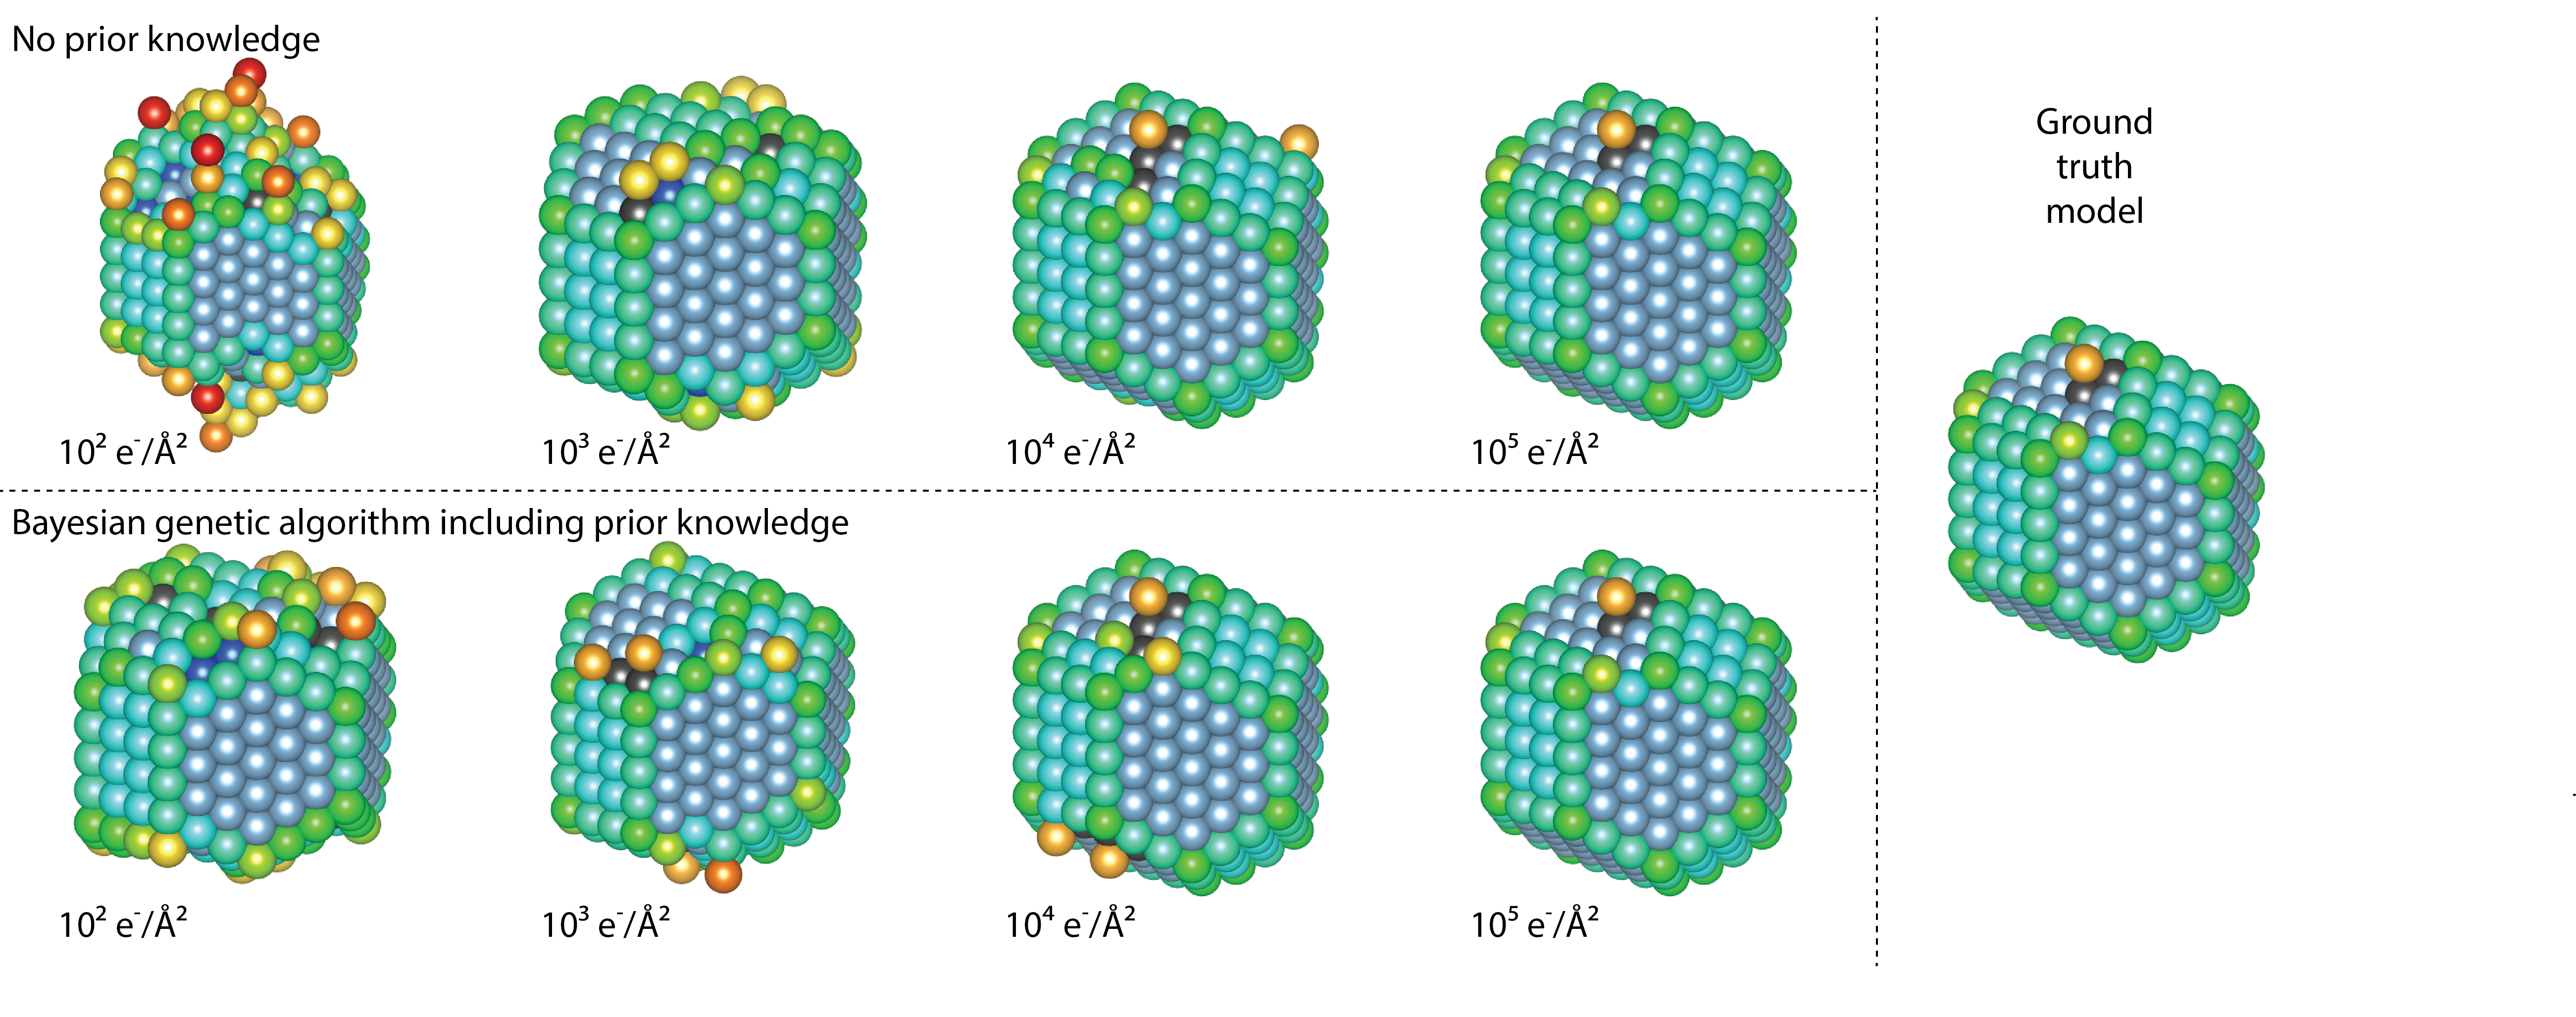
Figure 3 Ground truth model and reconstructed models without and with prior knowledge at different doses. The coloring of the Pt atoms indicates the nearest-neighbour coordination from 1 in red to 12 in dark blue.
3D atomic modelling
atom-counting
Bayesian inference
genetic algorithm
[1] S. Bals et al., Nature Communications 3 (2012), p. 897.
[2] L. Jones et al., Nano Letters 14 (2014), p. 6336.
[3] A. De Backer et al., Nanoscale 9 (2017), p. 8791.
[4] M. Yu et al., ACS Nano 10 (2016), p. 4031.
[5] Aarons et al., Nano Letters 17 (2017), p. 4003.
[6] A. De Backer et al., Ultramicroscopy 134 (2013), p. 23.
[7] This work was supported by the European Research Council (Grant 770887 PICOMETRICS to SVA and Grant 823717 ESTEEM3). The authors acknowledge financial support from the Research Foundation Flanders (FWO, Belgium) through project fundings and a postdoctoral grant to ADB. LJ acknowledges Science Foundation Ireland (SFI), the Royal Society, and the AMBER Centre.
10:42 - 10:54
Three dimensional imaging of inorganic nanoparticles has developed rapidly since first experiments in the early 2000s (Koster et al., 2000; Midgley & Weyland, 2003). The advent of aberration correctors and developments in electron tomography have led to three dimensional reconstructions in which individual atoms can be straightforwardly resolved (Yang et al., 2017; Van Aert et al., 2013). However, tomography experiments have the twin drawbacks of long acquisition times (and therefore high electron fluences) and sampling of relatively few nanoparticles.
In contrast, three dimensional imaging of viruses and proteins has recently been developed in to an automated tool that is applied with very low fluences and samples many thousands of particles (Tan et al., 2016; Xie et al., 2020). Automated routines for both acquisition and processing of data, and the development of user-friendly software, has widely disseminated the technique and this has contributed to a boom in its use.
We aim to emulate the progress made in cryo-EM by developing automated workflows for 3D imaging of inorganic nanoparticles. This encompasses nanoparticle image acquisition, segmentation of individual nanoparticles and 3D reconstruction routines.
As a first step towards automated acquisition of high angle annular dark field (HAADF) images, we have developed a DigitalMicrograph script that allows automated acquisition of atomic resolution images (Slater, 2019). The script handles sample movement, automated checking of focus and re-focusing, checking the presence of nanoparticles and the acquisition of images. Hundreds of atomic resolution images can be acquired with no human input beyond initial setup (Figure 1).
Figure 1. HAADF-STEM images of sputtered Au clusters collected using the autoSTEM DigitalMicrograph script. The images were acquired over an hour apart with no operator input in-between.
Once images of nanoparticles are acquired, they are then segmented and analysed using the ParticleSpy python package (Slater, 2020), which we have developed to support our work on inorganic nanoparticles. ParticleSpy allows straightforward segmentation in an automated pipeline, using either simple thresholding methods or a machine-learning based trainable segmentation.
3D images are then obtained using the same single particle reconstruction algorithms used in structural biology. That is, each particle image is treated as a 2D projection of a 3D structure and, after determining the relative orientation of each projection, a simple backprojection algorithm is used to obtain the structure in 3D. The main issue in using this methodology for inorganic nanoparticles is that they are typically not as homogeneous in size and shape as viruses or proteins. To combat this issue, we cluster sets of particles images in terms of their properties (e.g. projected area, total HAADF intensity and a number of shape measures) using functions in the ParticleSpy package.
As an initial example, a sample containing three distinct particle populations was investigated to determine whether the workflow could distinguish between significantly different particles (Slater et al., 2020) (Figure 2a). A clustering algorithm was found that not only separated the three known populations, but also split these into sub-populations based on size and morphology differences. A 3D reconstruction of each sub-population could then be obtained using single particle reconstruction software (Figure 2).
Figure 2. a) ADF image of mixed nanoparticle population. b) Surface renderings pf the 3D reconstructions obtained via single particle reconstruction from a set of ADF mages equivalent to (a). The three distinct particle morphologies can be individually determined and reconstructed.
We have demonstrated a workflow that can reconstruct 3D images of nanoparticles that are not identical in morphology. We hope that this workflow will allow a wide spectrum of nanoparticles to be efficiently characterised in 3D with little human input. The presented methodology also meets the twin goal of lowering the fluence per particle and sampling a much larger number of nanoparticles when compared with STEM tomography. Our future goal is to push this technique to reconstruction with atomic-resolution, ushering in the possibility of acquiring the atomic structure of nanoparticle populations with one button click in the electron microscope.
Nanoparticles, Scanning Transmission Electron Microscopy, Automation, 3D Imaging
Koster, A. J., Ziese, U., Verkleij, A. J., Janssen, A. H. & De Jong, K. P. (2000). Three-dimensional transmission electron microscopy: a novel imaging and characterization technique with nanometer scale resolution for materials science. J. Phys. Chem. B 104, 9368–9370.
Midgley, P. A. & Weyland, M. (2003). 3D electron microscopy in the physical sciences: The development of Z-contrast and EFTEM tomography. In Ultramicroscopy vol. 96, 413–431.
Nord, M., Vullum, P. E., MacLaren, I., Tybell, T. & Holmestad, R. (2017). Atomap: a new software tool for the automated analysis of atomic resolution images using two-dimensional Gaussian fitting. Adv. Struct. Chem. Imaging 3, 9.
Slater, T. (2020). ePSIC-DLS/ParticleSpy: v0.4.1. https://zenodo.org/record/3763073.
Slater, T. J. A. (2019). autoSTEM. https://github.com/ePSIC-DLS/DM-Scripts/blob/master/autoSTEM Dialog.s.
Slater, T. J. A., Wang, Y. C., Leteba, G. M., Quiroz, J., Camargo, P. H. C., Haigh, S. J. & Allen, C. S. (2020). Automated Single-Particle Reconstruction of Heterogeneous Inorganic Nanoparticles. Microsc. Microanal. 26, 1168–1175.
Tan, Y. Z., Cheng, A., Potter, C. S. & Carragher, B. (2016). Automated data collection in single particle electron microscopy. Microscopy 65, 43–56.
Van Aert, S., De Backer, A., Martinez, G. T., Goris, B., Bals, S., Van Tendeloo, G. & Rosenauer, A. (2013). Procedure to count atoms with trustworthy single-atom sensitivity. Phys. Rev. B 87, 064107.
Xie, R., Chen, Y. X., Cai, J. M., Yang, Y. & Shen, H. Bin (2020). SPREAD: A Fully Automated Toolkit for Single-Particle Cryogenic Electron Microscopy Data 3D Reconstruction with Image-Network-Aided Orientation Assignment. J. Chem. Inf. Model. 60, 2614–2625.
Yang, Y., Chen, C.-C., Scott, M. C., Ophus, C., Xu, R., Pryor, A., Wu, L., Sun, F., Theis, W., Zhou, J., Eisenbach, M., Kent, P. R. C., Sabirianov, R. F., Zeng, H., Ercius, P. & Miao, J. (2017). Deciphering chemical order/disorder and material properties at the single-atom level. Nature 542, 75.
10:54 - 11:06
Machine learning, fuzzy clustering, multimodal microanalysis, mineralogy, electron microscopy
11:11 - 11:14
We have implemented a trainable segmentation interface in the ParticleSpy Python package, which is built on the widely-used HyperSpy package. We have investigated the use of different classifiers and filter kernels to determine optimal parameters for segmentation of metal nanoparticles from transmission electron microscope (TEM) and scanning transmission electron microscope (STEM) images. We compare our results to global segmentation and trained convolutional neural networks.
Imaging of inorganic nanoparticles in the TEM/STEM is a ubiquitous method of determining their size and shape in a straightforward way [1]. To accurately extract particle information, it’s necessary to segment particles from the image background. This is most widely performed using global intensity thresholds that can be manually determined, or can be calculated using a range of algorithms (e.g. Otsu’s method [2]). Global thresholding relies on a clear difference in intensities between particles and background, which is not always apparent.
Instead of segmenting based solely on image intensity, a number of methods have been developed that use a set of images that have been convolved with different filter kernels. Filter kernels convolve a small matrix with an image to isolate characteristics of the image, such as edges, textures, or intensity such as local minima or maxima. These filter kernels generate a set of features from the image which can then be used to train a classifier based on a set of user labelled pixels. The classifier ‘learns’ from the training data by defining boundaries between the background-labelled and particle-labelled pixels, determined from filter kernel values. The rest of the image or additional images can be classified using this trained classifier. This process is typically referred to as ‘trainable segmentation’ [3].
Our aim was to produce effective and versatile trainable segmentation capable of rapid segmentation from a small sample of user–labelled pixels, and to understand the effective classifiers and filter kernels used in ParticleSpy.
We tested our trainable segmentation algorithm on 4 sets of images in order to test the algorithm on images with different features and contrast: 2 HAADF–STEM image sets with Pt nanoparticles on one and a mixture of Pd, PtNi and Au nanoparticles on the other, and 2 TEM image sets with Pd nanoparticles and Au nanoparticles (displayed in Figure 1).
Figure 2 shows the Balanced Accuracy, for each image type segmented by both global thresholding and trainable segmentation. All image sets have higher balanced accuracies and are more accurately segmented by trainable segmentation. It is also important to note that global thresholding still requires user input to refine the parameters of the threshold and select an appropriate thresholding algorithm to use.
We have implemented a default selection of filter kernels in ParticleSpy that perform well across all image types. The key factors of the filter kernels considered are their effectiveness and similarity compared to other selected filter kernels, as many highly effective, similar filter kernels do not improve segmentation. Effectiveness and similarity can be analysed using the 2-sample Kolmogorov-Smirnov Statistic and the Pearson Correlation Coefficient (PCC) respectively [4]. The 2-sample Kolmogorov-Smirnov Statistic is a measure of the separation of two distributions, an effective filter kernel is more capable of separating particle and background pixel distributions. The Pearson Correlation Coefficient is a normalised measure of the correlation of two data sets. A high PCC value suggests the two filter kernels have segmented the image in a similar manner. The absolute PCC has been used here, as a perfect negative correlation simply means inverted labelling of the pixels, which does not contribute additional information to the classifier. Figure 3 shows the KS Statistic and PCC on a set of AuGe TEM images. The most effective filter kernels are the Gaussian, Difference of Gaussians, Median, Minimum and Sobel filter kernels. The most similar of these are the Gaussian and Median filter kernels, and the most distinctive being the Difference of Gaussians and the Sobel filter kernel. The effectiveness and similarity of the filter kernels vary between image sets and can be tuned in ParticleSpy to each image type before classification.
Compared to global thresholding methods, trainable segmentation in ParticleSpy produces more accurate segmentations for a comparable quantity of user input, and its segmentation parameters can be highly customised, from the default set of parameters to the classifier used. It also offers the benefit that no pre-processing of the images is necessary. Trainable segmentation is not as accurate as segmentation using convolutional neural networks, but it is much faster to train and requires orders of magnitude fewer labelled pixels. The accessibility of ParticleSpy within Python will hopefully encourage wider use of trainable segmentation on electron microscope data sets.
image segmentation,
nanoparticles,
transmission electron microscopy
[1] T. J. A. Slater, E. A. Lewis, S. J. Haigh, Recent Progress in Scanning Transmission Electron Microscope Imaging and Analysis: Application to Nanoparticles and 2D Nanomaterials, 2016.
[2] N. Otsu, IEEE Trans Syst Man Cybern 1979, SMC-9, 62.
[3] I. Arganda-Carreras, V. Kaynig, C. Rueden, K. W. Eliceiri, J. Schindelin, A. Cardona, H. Sebastian Seung, Bioinformatics 2017, 33, 2424.
[4] M. J. Slakter, J. Am. Stat. Assoc. 1965, 60, 854.
11:14 - 11:17
We present a new method which allows us to reliably quantify dynamic changes in the atomic structure of nanomaterials using a time series of high-resolution annular dark field scanning transmission electron microscopy (ADF STEM) images [1,2]. The approach allows us to count the number of atoms in the atomic columns of a monatomic nanostructure in each frame of an ADF STEM time series using a hidden Markov model. We demonstrate improved reliability as compared to existing single-frame counting procedures. Furthermore, the method can be used to estimate the probability and cross-section for dynamic processes such as surface diffusion, adatom dynamics, beam effects, or structural changes during in situ experiments.
Quantitative analysis of atomic resolution electron microscopy images is commonly used to study the atomic structure of a nanomaterial. When such quantitative analysis is applied to a stationary structure, the insight into the dynamics is lacking. The atomic structure of nanomaterials can change over time via adatom dynamics, surface diffusion, beam effects, or during in situ experiments. Therefore, we propose a quantitative approach specifically designed to analyse the dynamically changing atomic structure using a time series of ADF STEM images [1,2]. A useful quantity for retrieving this atomic structural information is the so-called scattering cross-section, a measure for the total intensity of electrons scattered towards the annular detector from an atomic column [3,4]. The scattering cross-section increases with increasing atomic mass number Z and thickness in ADF STEM. Therefore, in pure-element nanomaterials, the number of atoms in each atomic column can be determined using these scattering cross-sections [5-11]. To quantify the dynamic changes in the number of atoms in each atomic column, we use a so-called hidden Markov model (HMM) [12]. HMMs are widely used in other fields of science owing to their optimal properties for modelling and analysing time series data. We apply HMMs to ADF STEM data for the first time.
A HMM consists of two layers: a “hidden" Markov chain state sequence and an observed sequence, schematically represented in Fig. 1. In the case of atom-counting, the “hidden” states are the number of atoms in each atomic column at the different times, observed only indirectly through the series of ADF STEM images. The observed sequence consists of the scattering cross-sections for each atomic column in each image. The changes in the number of atoms (hidden states) are described as a discrete set of transition probabilities. At each time, scattering cross-sections (observations) result from the underlying number of atoms (hidden states) following an emission probability, here described by a Gaussian distribution. The parameters of the HMM are estimated using a Baum-Welch algorithm, followed by a Viterbi path backtracking algorithm to determine the most likely state sequence [12-14].
The benefit of this new approach for atom-counting from a time series of ADF STEM series is illustrated in Fig. 2. We simulated scattering cross-sections corresponding to hypothetic ADF STEM time series with 40 frames of a changing Pt nanoparticle with 215 atomic columns, and a thickness up to 15 atoms. The number of atoms in a column can change by +/- 1 from frame to frame throughout the time series, with a probability of 10%. The atom-counting performance is compared with the existing atom-counting approach based on a single-frame analysis. The HMM far exceeds the atom-counting reliability of the existing methods, thanks to the embedding of transition probabilities which explicitly model atomic structural changes.
Next, we apply this to an experimental time series of a Pt wedge, shown in Fig. 3. The dynamic structural changes are summarised by the transition probabilities, displayed in Fig. 4. The white diagonal line plotted on top of the transition matrix indicates the transitions where the number of atoms in an atomic column stays the same. The upper and lower triangles contain the probabilities for an atomic column to respectively gain or lose one or more atoms. We do not expect structural changes to be caused by sputtering of atoms from the surface, only by surface diffusion, since the threshold energy for sputtering Pt atoms from a convex surface with step sites is 379 keV, well above the incident electron energy of 300 keV [15,16]. The HMM analysis enables us to quantify the probability for surface diffusion from this time series. We estimate the average probability for a surface atom to move to another column equal to 6.3%. We can even determine an experimental value for the average cross-section for surface diffusion, σ=5.60 x 10⁻⁶ Ų, which corresponds to a surface diffusion threshold energy of 1.09 eV, in close agreement with the theoretical value of 1.07 eV [17].
In conclusion, we present a new framework to reliably count the number of atoms in the atomic columns of a monatomic nanostructure in each frame of an ADF STEM time series using a hidden Markov model. We show that the performance of this new method significantly surpasses that of the current method for atom-counting. Furthermore, we interpret the transition probabilities in terms of a probability and cross-section for surface diffusion. The hidden Markov model for atom-counting therefore holds promise for a reliable quantification of dynamic structural changes by adatom dynamics, surface diffusion, beam effects, or during in situ experiments. The HMM was implemented in the freely available StatSTEM software [7].
Figure 1. The hidden Markov model for atom-counting models the number of atoms in each atomic column of the nanoparticle as the hidden states (top row) and the scattering cross-sections obtained from the ADF STEM images as the observations (bottom row). Hidden states and observations are connected through the emission probability (red). The hidden states change according to initial (blue) and transition probabilities (green).
Figure 2. Percentage of correctly counted atomic columns, with 95% confidence intervals, as a function of the electron dose in each individual frame.
Figure 3. (a) Experimental ADF STEM time series of a Pt wedge. (b) From the estimated hidden Markov model, the hidden state sequence is retrieved.
Figure 4. Transition matrix estimated by the hidden Markov model for the Pt wedge in Fig. 3.
References
[1] A. De wael et al., Physical Review Letters 124 (2020), 106105.
[2] A. De wael et al., Ultramicroscopy 219 (2020), 113131
[3] S. Van Aert et al., Ultramicroscopy 109 (2009), 1236.
[4] H. E et al., Ultramicroscopy 133 (2013), 109.
[5] S. Van Aert et al., Nature 470 (2011), 374.
[6] A. De Backer et al., Ultramicroscopy 134 (2013), 23.
[7] S. Van Aert et al., Physical Review B 87 (2013), 064107.
[8] A. De Backer et al., Ultramicroscopy 171 (2016), 104.
[9] J. M. LeBeau et al., Nano Letters 10 (2010), 4405.
[10] L. Jones et al., Nano Letters 14 (2014), 6336.
[11] A. De wael et al., Ultramicroscopy 177 (2017), 69.
[12] L. R. Rabiner, Proceedings of the IEEE 77 (1989), 257.
[13] A. J. Viterbi, IEEE Transactions on Information Theory 13 (1967), 260.
[14] G. D. Forney, IEEE Transactions on Information Theory 61 (1973), 268.
[15] R. F. Egerton et al., Ultramicroscopy 110 (2010), 991-997.
[16] S. Van Aert et al., Physical Review Letters 122 (2019), 066101.
[17] T. Halicioglu et al., Thin Solid Films 57 (1979), 241-245.
[18] This project has received funding from the European Research Council (ERC) under the European Union's Horizon 2020 research and innovation programme (Grant Agreement No. 770887 and No. 823717 ESTEEM3). The authors acknowledge financial support from the Research Foundation Flanders (FWO, Belgium) through grants to A.D.w. and A.D.B. and projects G.0502.18N and EOS 30489208. L.J. acknowledges the SFI AMBER Centre for support. A.V. and P.D.N. acknowledge the UK Engineering and Physical Sciences Council (EPSRC) for support (EP/K040375/1 and 1772738). A.V. also acknowledges Johnson-Matthey for support.
11:17 - 11:20
The abstract content is not included at the request of the author.
Ptychography, ADF, Quantitative STEM
[1] T. Seki, Y. Ikuhara, N. Shibata, Ultramicroscopy 193 (2018) 118–125.
[2] L.J. Allen, A.J. D׳Alfonso, S.D. Findlay, Ultramicroscopy 151 (2015) 11–22.