To save this page as a PDF, click this button and choose the PDF destination.

Stream 2: EMAG - In-situ microscopy

14:45 - 16:45 Thursday, 8th July, 2021

Sessions EMAG Conference Session

Session Organiser Cornelia Rodenburg, Jun Yuan


14:45 - 15:15

110 Assessing structure and dynamics of biological systems via Liquid Phase Electron Microscopy

Dr Lorena Ruiz-Perez1, Mr Cesare De Pace1, Dr Silvia Acosta-Gutiérrez1, Mr Gabriel Ing1, Mr Gabriele Marchelo1,2, Dr Simona Pilotto3, Prof Finn Werner3, Prof Francesco L Gervasio1,4, Prof Giuseppe Battaglia1,5,6
1University College London, Department of Chemistry, London, United Kingdom. 2Italian Institute of Technology, Genova, Italy. 3University College London, Department of Structural and Molecular Biology, London, United Kingdom. 4University of Geneva, Pharmaceutical Sciences, Geneva, Switzerland. 5Institute for Bioengineering of Catalunya (IBEC), The Barcelona Institute of Science and Technology, Barcelona, Spain. 6Catalan Institution for Research and Advanced Studies (ICREA), Barcelona, Spain

Abstract Text

Recent developments in electron-transparent materials have paved the way for liquid-phase electron microscopy (LP-EM) and sample imaging in a liquid environment.  LP-EM  offers tremendous potential in a myriad of fields ranging from soft matter, nano-materials, polymer assemblies, biomaterials, synthetic biology, and design and catalysis to name a few. The liquid nature of the specimen presents exciting new prospects. It is well known that dispersed particles in a liquid undergo Brownian motion involving continuous translational displacement and rotation of the particles. Such rotation means that each particle dispersed in the liquid will show several profiles under the TEM disclosing potentially all of its surface. This phenomena can be exploited for structure reconstruction. 

Image reconstruction in liquid-state poses several challenges, and most importantly, it undermines the single-particle analysis assumption that the three-dimensional objects captured on the image sensor are identical. We propose the combination of all-atom simulations with LP-EM to complement structural studies with dynamic investigations. In this work, we exploited LP-EM to image the dynamics of particles undergoing Brownian motion, using their natural rotation to access the particle 3D conformational landscape. In this fashion 3D reconstructions of particles in liquid are performed  v using tomographic techniques. We have selected two case studies  for our approach according to prior data accessibility and physiological environmental factors: apoferritin and archaeal RNA polymerase. We show that our approach allows us to get sub-nanometer spatial resolutions of protein structures, either imaging one by one and assessing different conformational states or combining several proteins into one statistical conformational ensemble.


The work presented was accomplished using a Jeol JEM 2200FS equipped with an in-column omega filter in combination with the high performance in-situ camera from Gatan, the K2-IS. The ultra-high sensitivity of the K2 allows low-dose imaging modes limiting considerably the electron dose damage. The in-situ TEM holders used were the Ocean and Stream holders from DENSsolutions. 


Keywords

low dose imaging, protein reconstruction, Liquid Phase TEM, in-situ TEM, protein dynamics, dynamics TEM


15:15 - 15:27

218 Understanding Electron Beam Effects on Liquid-phase Specimens using Low Dose Electron Energy-Loss Spectroscopy

Dr Liam Spillane1, Dr Sophia Betzler2,3, Dr Ming Pan1, Dr Ray Twesten1, Dr Haimei Zheng2
1Gatan Inc., Pleasanton, USA. 2MSD LBL, Molecular Foundry, Berkeley, USA. 3College of Chemistry, UC Berkeley, Berkeley, USA

Abstract Text

Liquid cell electron microscopy has been used to investigate and study many chemical reactions in real time, such as: nanoparticle growth, battery electrochemistry and catalysis. Understanding the electron beam-specimen interactions present in liquid phase is a fundamental step toward the correct interpretation of in-situ observations derived from such experiments, in order to allow conclusions to be drawn with confidence that may then be applied to macroscopic systems ex-situ.

Electron energy-loss spectroscopy (EELS) performed in the scanning transmission electron microscope (STEM) is well established as a potent technique for probing local chemistry and electronic structure at high spatial resolution. However, where high spatial resolution is not a requirement of a given experiment, STEM-EELS becomes ideal for providing highly tunable and well-defined specimen dose. Dose rate and therefore the accumulated dose, is a function of probe current and probe defocus (figure 1). As both the probe position and scan area are also inherently precise in STEM, it is possible to irradiate target specimen features to nearly the “first electron” dose (~ 0 e-/Å2). To acquire useable data at ultra-low dose and also at high dose resolution, a detector that is both high speed and high sensitivity is a fundamental requirement.  

In this work, we use a transmission-mode electron-counting detector fitted to an optimized EELS spectrometer (GIF Continuum K3) to acquire time resolved electron energy-loss from carbonate solutions to study early reaction products formed from the interaction between the electron beam and aqueous solution. Radiolysis of these solutions produces a number of molecular reaction products (CO2, CO, O2, H2) all of which display characteristic spectral features in the low energy-loss region of the EELS spectrum. Using this detector-spectrometer configuration, it was possible to acquire low-loss EELS spectra at an ultra-low probe current (0.2 pA) and access useable dose rates as low as 0.15 e-/Å2/spectrum.

Initial results show the formation of three characteristic peaks in the low-loss region at specimen doses as low as 1.0 e/Å2. The normalized peak intensity of these features was seen to increase up to doses of approximately 10.0 e-/Å2. Above 10.0 e-/Å2, no measurable changes were observed up to doses of 60.0 e-/Å2 (figure 2). In this presentation, we will expand upon these findings and demonstrate low-dose STEM and temperature dependent EELS as experimental approaches that provide detailed understanding of the different stages of the radiolytic degradation of liquids during in-situ liquid cell experiments. These insights are essential to limit the impact of radiolysis on the results of liquid cell experiments by developing efficient protection strategies.

This work was supported by the U.S. Department of Energy (DOE), Office of Science, Office of Basic Energy Sciences (BES), Materials Sciences and Engineering Division under Contract No. DE-AC02-05-CH11231 within the KC22ZH program. Work at the Molecular Foundry of Lawrence Berkeley National Laboratory (LBNL) was supported by the Office of Science, Office of Basic Energy Sciences, of the U.S. Department of Energy under Contract No. DE-AC02-05CH11231.


Uncaptioned visual

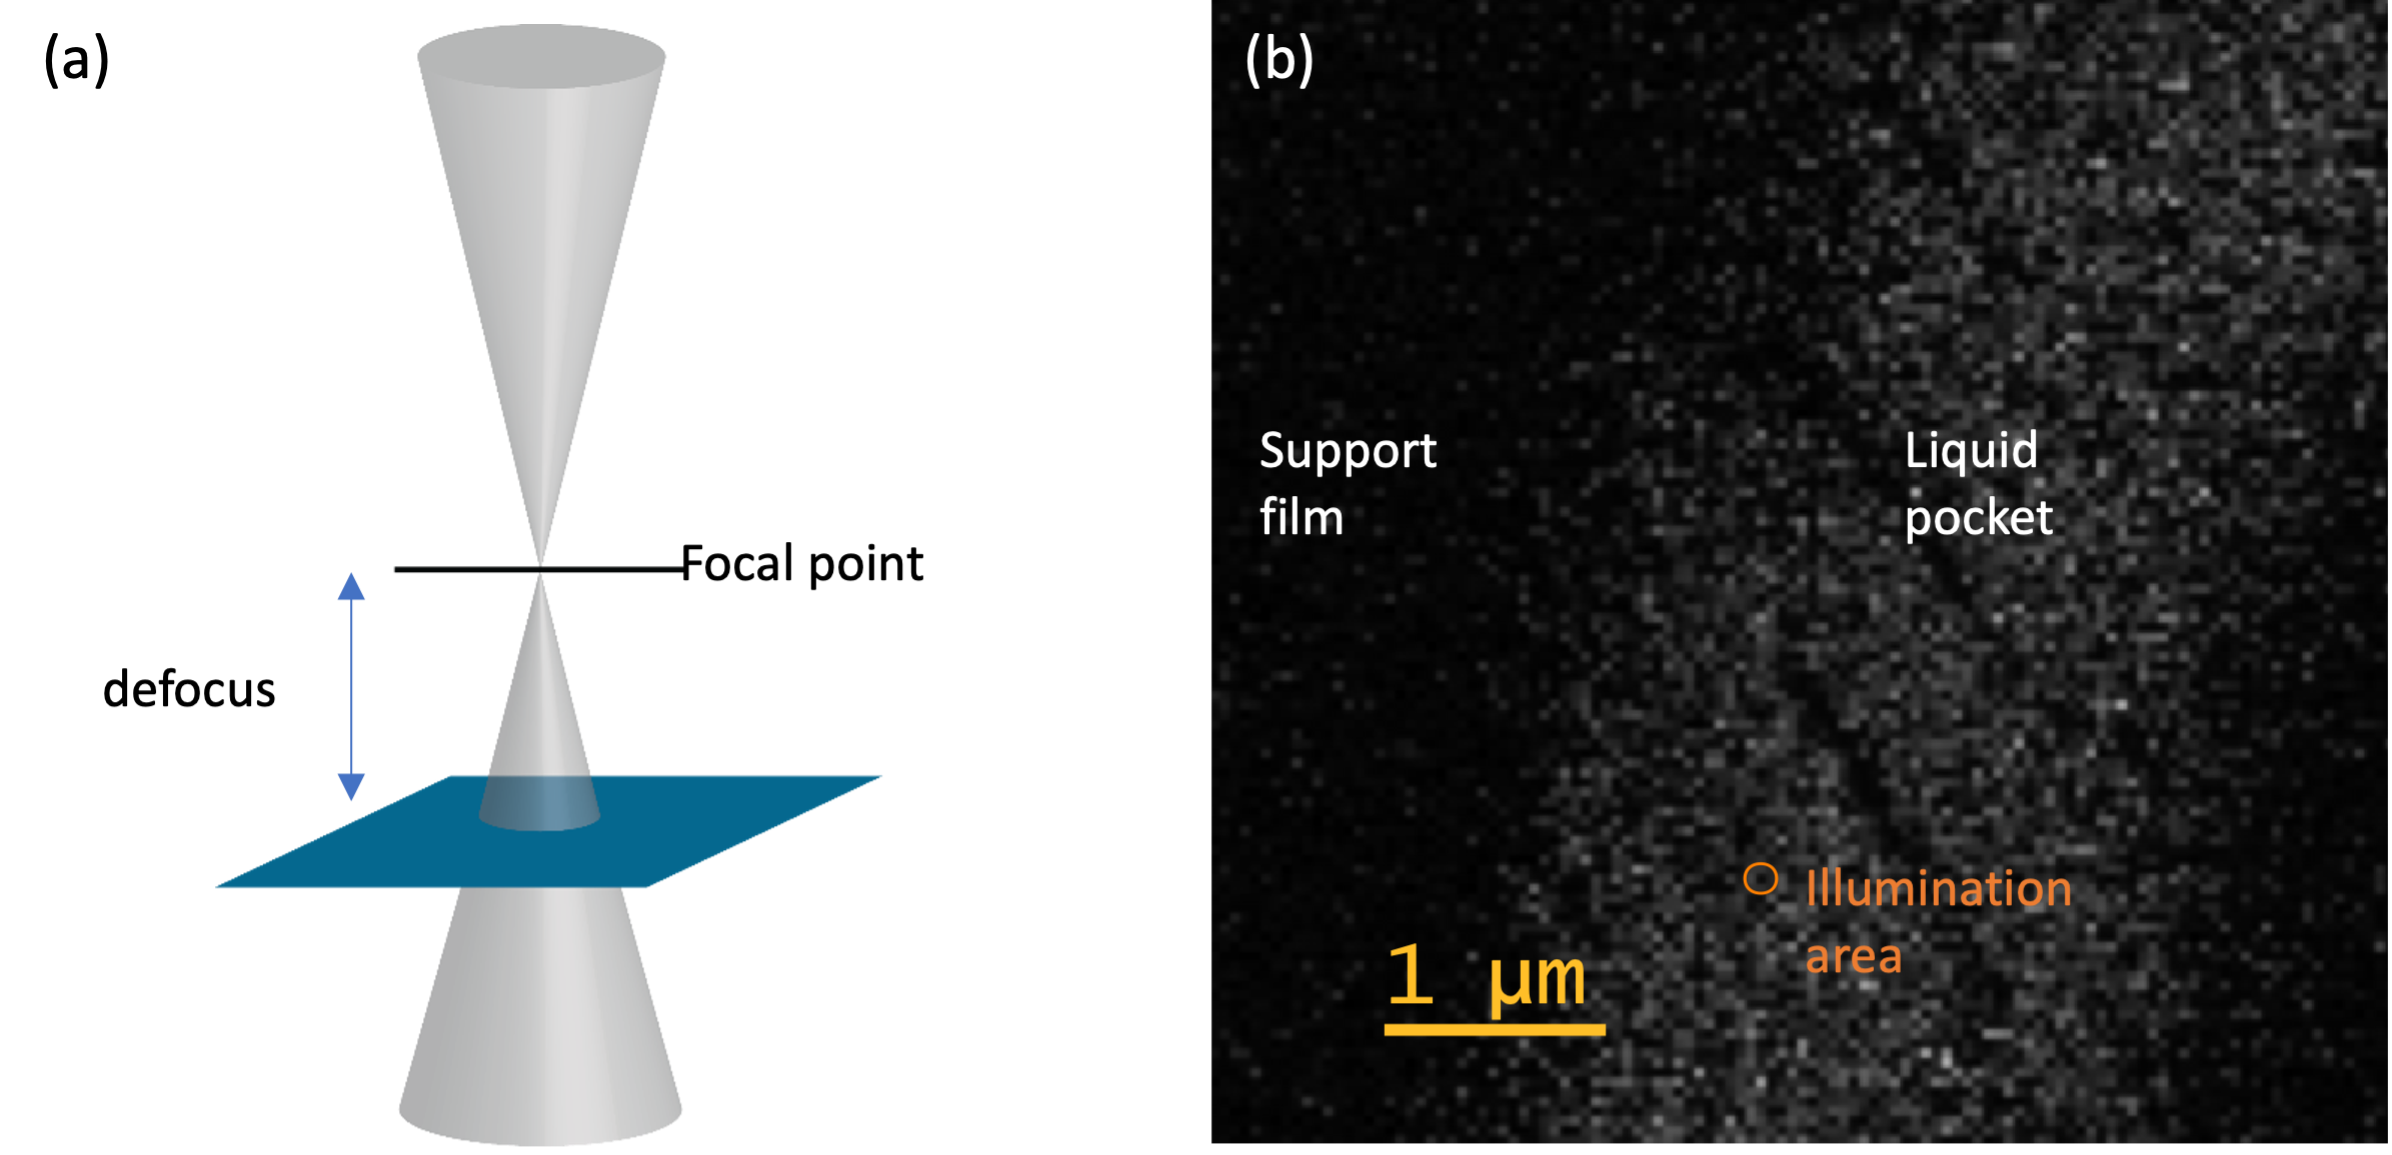
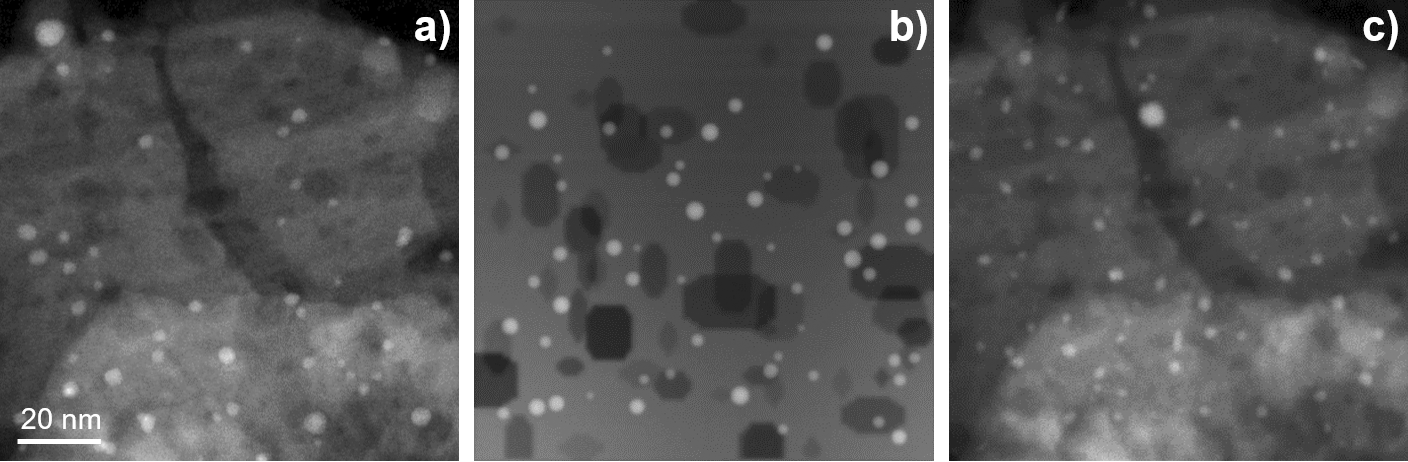
Figure 1: (a) Schematic diagram showing effect of STEM probe overfocus on illumination area at specimen position. (b) Example ADF STEM image showing support film and liquid pocket regions from a typical liquid cell specimen. Illumination area shown is 80 nm in diameter.


Uncaptioned visual

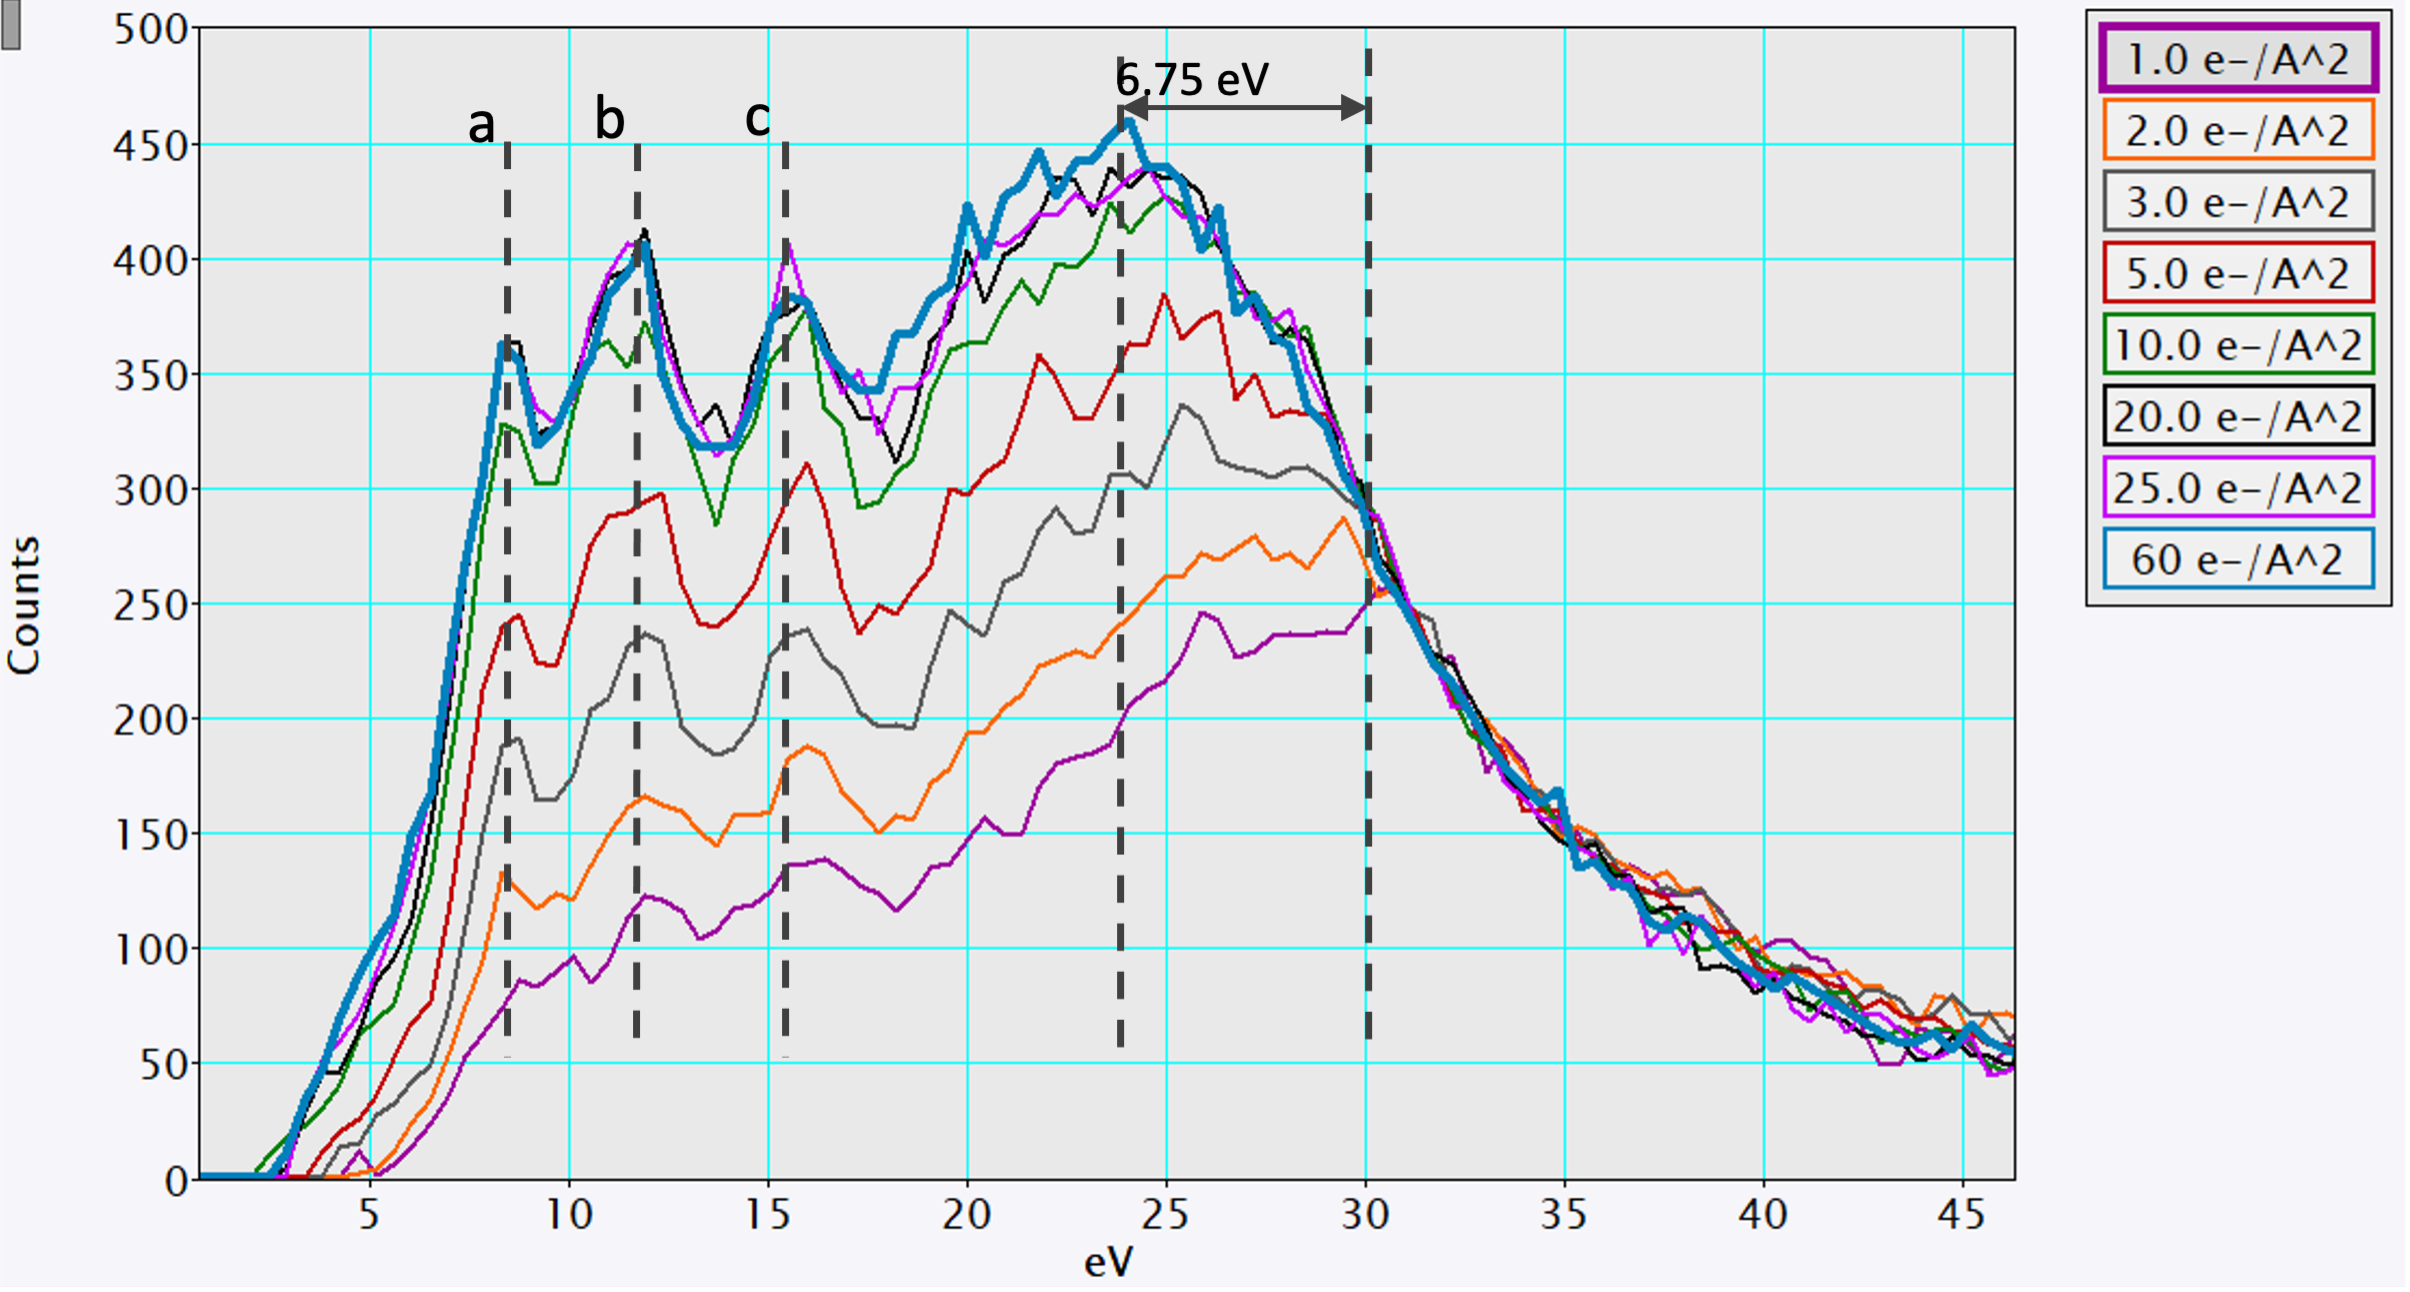
Figure 2: Single scattering distribution (SSD) low-loss spectra from aqueous carbonate solution specimen at accumulated doses of: (1.0, 2.0, 3.0, 5.0, 10.0, 20.0, 25.0, 60) e-/Å2. SSD achieved by Fourier-log deconvolution. SSD spectra were normalized against relative thickness and integral in the 30 – 35 eV energy window. Characteristic peaks a, b and c were found to increase in intensity up to a dose of 10.0 e-/Å2. A shift in plasmon energy of 6.75 eV was also observed.


Keywords

STEM, EELS, Low Dose, Liquid Phase, Liquid Cell, Scanning Transmission Electron Microscopy, Electron Energy-Loss Spectroscopy, Spectroscopy, Beam Sensitive Materials, Liquid Cell Microscopy, Electron Counting, Radiolysis, Beam Damage,


15:27 - 15:39

298 Multiple Object Tracking of Supported Nanoparticles during in situ Environmental TEM Studies of Nanocatalysts

Prof. Thierry Epicier1,2, Dr. Khuram Faraz3,2, Ass-Prof. Thomas Grenier4, Prof. Christophe Ducottet3
1IRCELYON, Univ Lyon-UCBL-CNRS, Villeurbanne, France. 2MATEIS, Univ Lyon-INSA de Lyon-UCBL-CNRS, Villeurbanne, France. 3LaHC, Université Lyon, UJM-Saint Etienne-CNRS-Institut Optique Graduate School, St-Etienne, France. 4CREATIS, Univ Lyon-INSA de Lyon-UCBL-CNRS-INSERM, Villeurbanne, France

Abstract Text

Characterizing at high spatial resolution nanoparticles (NPs) involved in heterogeneous catalysis is a key step of the understanding of their potential efficiency in catalytic processes. Using Environmental Transmission Electron Microscopy (ETEM), it is now possible to study these nanocatalysts under reactive conditions, i.e. under gas and temperature, thus mimicking or, in some best cases, reproducing experimental working conditions corresponding to their conditioning or activation. With such in situ or operando approaches, it is possible to investigate the reasons for deactivation of the catalyst, such as the growth of the NPs either by Ostwald ripening or coalescence [1]. Recording series of images at reasonable temporal frequencies such as permitted by modern fast cameras allows tracking the dynamic evolution of a quite large population of NPs exposed in situ to gas and heat stimuli. A meaningful and quantitative analysis of such observations can then be performed, assuming a correct control or possible damages induced by electron irradiation. To do so, tedious measurements are needed to detect the NPs and identify their trajectories when they possibly move and interact between them by diffusion processes. This is typically a multiple object tracking (MOT) problem, which is well-known and approached by automatic routines since a few decades for important societal subjects, such as pedestrians’ localization or traffic survey, see e.g. [2].

The purpose of the present work is to derive a robust and automatic pipeline to achieve this task on the basis of Machine Learning (ML) and MOT approaches. It will be applied to the calcination study of Pd NPs supported on delta-alumina, a well-known catalytic system for selective hydrogenation. Details of the TEM study were reported previously [3]. Basically, crushed samples were heated in situ in a Titan ETEM (FEI / Thermo Fisher Scientific Titan G2, 80-300 kV) up to 450°C in a few mbar of oxygen and ADF-STEM (Annular Dark Field Scanning TEM) sequences of images were acquired during up to 3 hours, with a variable time interval of a few minutes between successive frames.

For the detection of NPs in experimental images such as Figure 1a), we used the well-known Unet neural network [4]. Excellent results can be obtained once the network has been properly trained. Indeed, the key for a successful training is to rely on well-characterized and annotated data constituting the ground truth to which the network is confronted and which allows to train it. To avoid a tedious manual and subjective analysis of experimental data by one or several experts, we have developed a simple and efficient method based on simulated images for which all information is then known a priori.  According to the ideally incoherent nature of more or less high angle scattering processes controlling the collected intensity of ADF STEM images, it is easy to produce simulated images such as in Figure 1b). Any population of spherical (for simplicity) NPs, with known but varying chemical composition and size, can be generated on a supporting media with its own morphological characteristics (variable thickness, rugosity and pore distribution). We also developed a random walk routine to simulate dynamic sequences by moving NPs in agreement with expected size and intensity variations during coalescence, crossing or disappearance events. 

To fine-tune the network pre-optimized on such synthetized data, further simulated images are generated using true experimental micrographs as a support after having inpainted the inside of existing NPs (Figure 1c).


Uncaptioned visual

Figure 1: a) Low mag STEM image of the system Pd@d-Al2O3. b): Simulation exhibiting indicative similar features as compared to the experimental micrograph in a). c): Simulated image deduced from the experimental one (a) after erasing the NPs and generating new pseudo-circular ones. 


The second step of the approach concerns the NP tracking. We have implemented additional features to the algorithm developed by Milan et al. [2] initially dedicated to the tracking of pedestrian walks. It consists in a continuous energy minimization (CEM) which accounts for energy terms representing events such as illustrated in Figure 2. Regarding the nature of the problem treated here, we aimed at considering events and features that are mainly unrealistic in the case of humans or vehicles:

(i) fusion (coalescence) of two particles into a single one

(ii) less probable but still possible, of one particle which may divide into smaller ones

(iii) the required consistency of mass conservation during events (i) and (ii), as well as the global invariance of the volume of a single NP during its trajectory without interaction with others (hypothesis which can however be flawed if Ostwald ripening occurs involving too small particles or multimers and even single atoms which may have not been detected).

(iv) crossing of particles lying on upper and lower surfaces of the substrate.


Uncaptioned visual

Figure 2: Sketches of the tracking problematic. a): Positions of NPs identified on 13 frames of a dynamic sequence. b): Possible identification of 3 trajectories A, B, C. Note that the groups of positions B2-B4, B8-B10 and C8-C10 (C9 supposed to be missed) show non-monotonous size variations which may indicate non-optimal tracking results. c): Better solution found according to a better identification of specific events: crossing in position B3 (intensity increase due to the A3+B3 superimposition), split of A6 into A’7 (small then possibly missed) and A’’7 and fusion A’8+B8. In these two last cases, addition of intensities and volume conservation can be discriminant. 


According to the above, size and intensity energies criteria were added to the CEM algorithm, which serve to identify and confirm fusion / division events such as sketched in figure 2.

Results of the Unet-based identification of NPs and of the modified CEM tracking approach will be illustrated on both simulated and experimental dynamic sequences [5].

Keywords

Machine learning; Multiple Object Tracking; neural network; Environmental TEM; nanoparticles 

References

[1] T.W. Hansen et al., Accounts of Chemical Research, 46 8 (2013) 1720.

[2] A. Milan et al., PAMI, 38 10 (2016) 2054.

[3] T. Epicier et al., Catalysis Today, 334, 15 (2019), 68.

[4] 0. Ronneberger et al., Lect. Notes Comput. Sci. 9351 (2015) 234.

[5] The authors thank the EUR SLEIGHT https://manutech-sleight.com/) for financial support, CLYM (www.clym.fr) for the access to the ETEM and IFPEN (Solaize, F) for providing samples.


15:39 - 15:51

190 Mapping Crystalline Regions During In-Situ Heating- Comparing TEM and 4D STEM

Benjamin Miller, Anahita Pakzad, Liam Spillane, Bernhard Schaffer, Cory Czarnik
Gatan, Inc., Pleasanton, CA, USA

Abstract Text

Often during in-situ TEM experiments, it is important to see and distinguish crystalline regions in a sample. Whether grains in a polycrystalline sample, nanoparticles on an amorphous support, or crystals nucleating from an amorphous material, the ability to detect these crystalline regions is valuable. Yet, this can be challenging for several reasons. In a large TEM image, it may be difficult to see at a glance the extent of crystalline regions because neighboring regions are not easily distinguished, or because the large image cannot be displayed at full resolution on the monitor. When using 4D STEM, it is also inherently difficult to see anything as visualization requires a dimensional reduction that can hide important information. In both cases, the difficulty is increased if a series of images or data cubes are acquired as part of an in-situ experiment.

In this work, we demonstrate Python-based processing of both 4D STEM and high-resolution TEM images to map the spatial distribution of crystalline regions. This can be done (with some limitations) during live during acquisition, or it can be applied to previously acquired datasets. In the case of 4D STEM, each diffraction pattern is processed to find the maximum intensity pixel, while masking a user-defined central region of the pattern. The direction from the pattern center, spacing, and intensity of this maximum point are determined, and color maps are produced. The hue can be either the angle or distance from center while the brightness of the color is determined by the intensity. A 2D color map is thus generated from each 4D data cube. If a series of data cubes is acquired, this results in a color video. This approach can be extended for processing large high resolution TEM images. First a grid of overlapping windows is extracted from a single large 2D image, and the FFT of each window is computed. These FFTs are placed into a 4D cube which is analogous to that generated using 4D STEM, but with diffractograms instead of diffraction patterns. This 4D cube of FFTs can then be analyzed in the same way as a 4D STEM data cube.

This processing approach has been applied to repeated in-situ melting and crystallization of Sn nanoparticles. During acquisition, it was not obvious that the nanoparticles recrystallize in different orientations each time, but this is clear from the processed data. It also becomes obvious from the processed HR TEM video that some particles crystallize before others, as seen in Figure 1. It is not possible to see this in the 4D STEM data, due to the temporal resolution we achieved with that technique (one 24x24 pattern data cube every ~10 s).

Uncaptioned visual

Figure 1. Maps generated from 2 consecutive frames from 2 in-situ series of HR TEM images and 4D STEM datasets of the same cluster of particles. For both types of data, a similar mapping technique has been applied. The 2nd row of maps shows spatially upscaled data (upscaled by a factor of 2). Blue and green arrows indicate where the same 2 particles appear in all the maps. White arrows indicate a particle (green in the map) which crystallized <0.5 s later than 2 other particles (blue and red). This was detectable due to the good temporal resolution of the in-situ TEM technique.

While we are processing the 4D STEM data and the HR TEM data in a similar way, there are differences and tradeoffs which make each technique optimal for some different experiments. The primary benefit of the HR TEM technique is the ability to capture data with the excellent temporal resolution afforded by TEM and modern in-situ cameras. In the data we will present, images were captured at 20 fps, but much higher framerates are possible. However, the spatial resolution of the FFT-based maps tends to be poor. This is because a large number of pixels in the TEM image must be processed to generate a single map pixel. In the data shown in Figure 1, a 128x128 region in the image generates a single map pixel. This can be mitigated to some extent by overlapping the analysis windows (in this case, we process a new 128x128 region every 32x32 pixels), but this oversampling results in some blurring or delocalization in the maps, and the spatial resolution of the technique becomes less well-defined. Finally, the volume of reciprocal space that is sampled using HR TEM is small when compared to 4D STEM. This means that for the same sample region, more lattice spacings will be observed using 4D STEM. This is especially pronounced for TEMs without aberration correction, and many crystalline regions will be missed in any given analysis simply because they are not in a suitable orientation, and thus no lattice spacings are visible1.

For both 4D STEM and the FFT-based processing of HR TEM images, the resulting maps tend to have few pixels. This can be partially mitigated by upscaling the pixel size of the maps as shown in Figure 1, similarly to work by researchers at Oxford2. To do this properly, some other dimension in the data must be summed. For the 4D STEM case, this can be in the diffraction patterns, and for the HR TEM case, it can be the temporal dimension.

Ultimately, the goal for this processing is to perform it live during acquisition to guide decision making at the microscope. The processing speed is a limiting factor at the moment, with one 1728x1728 pixel frame processed into a 55x55 pixel map every 3 seconds. However, with better parallelization of the processing in Python, faster CPUs or GPUs, and other optimizations, this will undoubtedly become faster in the future. Processing 4D STEM data cubes is already fast in comparison, since computationally expensive FFTs are not required. As long as data does not need to be pre-processed (e.g. to remove outliers) a similar 55x55 pixel map can be produced in just 0.5 seconds, so the 4D STEM technique is limited by the acquisition, not data processing.


Keywords

In-Situ

Python

Real-Time Processing

4D STEM

Crystallization

High Resolution TEM

Nanoparticles

References

1.            Fraundorf, P., Qin, W., Moeck, P. & Mandell, E. Making sense of nanocrystal lattice fringes. Journal of Applied Physics (2005).

2.            Jones, L. et al. Managing dose-, damage-and data-rates in multi-frame spectrum-imaging. Microscopy (2018).


15:56 - 15:59

12 An off-axis electron holography investigation of the perpendicular shape anisotropy and thermal stability of STT-MRAM nano-pillars

Dr Trevor Almeida1, Dr Steven Lequeux2, Mr Alvaro Palomino2, Mr Nuno Caçoilo2, Dr Aurélien Masseboeuf2, Dr Ricardo Sousa2, Dr Olivier Fruchart2, Dr Ioan Lucian Prejbeanu1, Dr Bernard Dieny2, Dr David Cooper1
1Univ. Grenoble Alpes, CEA, LETI, Grenoble, France. 2Univ. Grenoble Alpes, CEA, CNRS, SPINTEC, Grenoble, France

Abstract Text

Summary

The magnetic properties and thermal stability of STT-MRAM nano-pillars is investigated using off-axis electron holography. Energy dispersive X-ray spectroscopy reveals the 3:1 aspect ratio of the magnetic FeNi section within the nano-pillars, whilst electron holography confirms this elongated shape induces a favoured magnetic easy axis. Combining electron holography with in-situ heating demonstrates that this high aspect ratio provides a perpendicular shape anisotropy that is thermally stable up to 225°C, and hence resistant to thermal variations during operation.    


Introduction

Magnetic random-access memory (MRAM) is a non-volatile memory based on the storage of one bit of information by a ferromagnetic memory carrier. Spin-transfer torque (STT) MRAM is viewed as an exciting replacement for embedded FLASH memory and has attracted great interest by the microelectronics industry. Out-of-plane STT-MRAM involves the use of a magnetic tunnel junction (MTJ) comprising an MgO tunnel barrier (1 – 1.5 nm) sandwiched between two thin perpendicularly-magnetized layers: one magnetically-pinned reference layer, and one switchable storage layer. The electrical resistance of the MTJ changes significantly when the layers are magnetized in parallel and antiparallel states, providing a system of readable / writable ‘0’ or ‘1’ binary information. The areal bit density of modern STT-MRAM can be improved further by reducing the in-plane size of the MTJ, which however may reduce the thermal stability of the storage layer. One solution is to increase the storage layer thickness to larger than its diameter so that its out-of-plane aspect ratio provides additional thermal stability through perpendicular shape anisotropy (PSA). Previous studies have shown that the PSA-STT-MRAM are indeed highly thermally stable, making them an exciting solution to downsize scalability of STT-MRAM at sub-20 nm technology nodes1,2. However, our knowledge of the thermal stability of these STT-MRAM nano-pillars is often indirect, relying on magnetoresistance measurements and micromagnetic modelling. In order to understand fully their thermomagnetic behavior, it is necessary to examine the effect of temperature directly. The advanced transmission electron microscopy (TEM) technique of off-axis electron holography allows imaging of magnetization within nano-scale materials. Here, we use electron holography to image the micromagnetic configuration of the nano-pillars in the presence of PSA and to visualize its thermal stability through in-situ heating. 


Methods/Materials

An array of FeCoB / NiFe nano-pillars was fabricated through sequential e-beam lithography, reactive ion etching and ion beam etching1. TEM samples were prepared by depositing a protective layer (~ 1 µm) of resin on the array prior to a protective Pt layer being deposited by the focused ion beam (FIB). Cross-sectional TEM lamellae were transferred to Omniprobe copper slots and thinned to ~ 300 nm using conventional FIB methods. The protective resin layer was removed by plasma etching and the remaining Pt layer was broken with the micromanipulator. Scanning TEM (STEM) imaging was performed using a probe-CS-corrected Thermo Fisher Titan TEM at 200kV, whilst energy dispersive X-ray (EDX) spectroscopy provided chemical analysis. Off-axis electron holograms were acquired under field-free conditions in Lorentz mode on a Gatan OneView 4K camera using a Thermo Fisher Titan TEM equipped with an image-CS corrector and an electron biprism. The magnetization states of the nano-pillars were visualized through separation of the magnetic contribution to the phase shift from the mean inner potential (MIP), achieved by tilting and applying the strong field of the objective lens (< 1.5T) to reverse their magnetism. In-situ heating up to 250°C was performed using a Gatan heating holder under field-free magnetic conditions. The heating was repeated and the magnetic reversal was performed at each temperature interval to isolate the MIP, and subtracted from the first heating to reconstruct the thermomagnetic behavior of the nano-pillars3,4


Results and Discussion

Figure 1 presents the morphology, chemical composition and thermal stability of an individual nano-pillar from the etched FeCoB / NiFe stack. The schematic of Fig. 1a displays the full stack of the MTJ cell, where the thick NiFe section is deposited on a conventional stack to provide the PSA in the storage layer2. The STEM image (Fig. 1b) and EDX map (Fig. 1c) reveal that the NiFe section of nano-pillar is 60 nm high with a diameter of ~ 20 nm, and is separated from the hard Ta mask by a Ru layer. The magnetic induction map of Fig. 1d shows that the magnetization lies along the elongated axis of the NiFe section at 20°C, as indicated by the white arrows. Magnetic induction maps acquired during in-situ heating to 175°C (Fig. 1d) and 225°C (Fig. 1e) shows the nano-pillar to retain this direction of magnetization at elevated temperatures. This confirms that the high-aspect-ratio NiFe nano-pillar provides out-of-plane PSA that is thermally stable up to 225°C, and hence resistant to thermal variations during operation. This thermal robustness is very attractive for applications that involve a wide range of temperatures, e.g. automotive, -40°C to + 150°C.


Uncaptioned visual

Figure 1. (a) Schematic of a PSA-STT-MRAM MTJ cell with a 60 nm NiFe storage layer, where the white arrows denote the expected magnetic easy axis2. (b) STEM image of a PSA pillar with a diameter of ~ 20nm; and (c) the associated EDX chemical map showing the elemental distribution of Ta (red), Ni/Fe (blue) and Ru (turquoise). (d-f) Magnetic induction maps reconstructed from electron holograms acquired during in-situ heating at (d) 20°C; (e) 175°C; and (f) 225°C. The contour spacing is 0.042 rad for all the magnetic induction maps, and the magnetization direction is shown using white arrows, as depicted in the color wheel (inset).


Conclusions

Off-axis electron holography has revealed that the high aspect ratio of the NiFe section within the nano-pillar induces a favoured magnetic easy axis through PSA. In-situ heating further confirms that the nano-pillars are thermally stable up to 225°C and the PSA provides a thermal robustness that is attractive for applications operating over a range of temperatures.


Keywords

Off-axis electron holography

In-situ TEM

Nanomagnetism

MRAM devices

References

[1] N. Perrissin et al., Nanoscale 10, 12187-12195 (2018). 

[2] S. Lequeux et al., Nanoscale 12, 6378-6384, (2020). 

[3] T. P. Almeida et al., Geophys. Res. Lett. 43, 8426–8434 (2016).  

[4] T. P. Almeida et al., Sci. Adv., 2 (4), e1501801 (2016).


15:59 - 16:02

330 Observing Changes in Polar Domain Structures in Ferroelectric Oxide Thin Films Using Atomic Resolution In-Situ Electron Microscopy

James Gott1, Dorin Rusu1, Jonathan Peters2,1, Marin Alexe1, Ana Sanchez1
1University of Warwick, Coventry, United Kingdom. 2Trinity College Dublin, Dublin, Ireland

Abstract Text

Under certain physical boundary conditions, ferroelectric oxides can form complex domain structures that can range from 180⁰ domain walls to polar vortices. These domain patterns can exhibit exotic properties, such as enhanced conductivity, with potential use in next generation devices [1,2]. Whilst the domain structure of this family of materials has been widely studied in standard conditions with no environmental changes, it is only recently that research has examined the change in polar domain structures in response to external stimuli [3,4].

So far, in-situ work with ferroelectrics has primarily dealt with system response to applying a bias across a sample. The effects of this have been observed using low resolution techniques such as conventional transmission electron microscopy (TEM), dark-field/bright-field TEM or other larger area investigative techniques such as X-ray diffraction [3,5,6]. There has so far been limited in-situ work that probes system response to temperature changes at an atomic level [7].

Here we examine exotic domain structures within epitaxial PbTiO3 films grown at high temperature using pulsed laser deposition. Aberration-corrected STEM is used in combination with modern in-situ MEMS chips to map electric polarisation before, during and after annealing within the microscope (Figure 1). This powerful combination of techniques allows us to probe the stability and dynamics of complex domains (such as polar vortices) and the interplay of their boundary conditions. This provides insight into the mechanisms that form novel domains during growth, opening the path to optimising and controlling growth to make high quality devices or new polar phases.

Uncaptioned visual

Figure 1. Tracking the change in polarisation of a PbTiOthin film using atomic resolution annular dark field scanning transmission electron microscopy (ADF-STEM). Polarisation maps are obtained before, during and after annealing. Scale bar 2 nm.

Keywords

Ferroelectric, Oxide, Aberration Corrected STEM, In-Situ Microscopy

References

[1] S. Das, Z. Hong, M. McCarter et al. A new era in ferroelectrics APL Mater. 8, 120902 (2020)

[2] G. Tian, W.D. Yang, X.S. Gao et al. Emerging phenomena from exotic ferroelectric topological states. APL Mater. 9, 020907 (2021)

[3] L. Li, L. Xie & X. Pan. Real-time studies of ferroelectric domain switching: a review. Rep. Prog. Phys. 82, 126502 (2019)

[4] K. Moore, U. Bangert & M. Conroy, Aberration corrected STEM techniques to investigate polarization in ferroelectric domain walls and vortices. APL Mater. 9, 020703 (2021)

[5] P. Gao, J. Britson, J. Jokisaari et al. Atomic-scale mechanisms of ferroelastic domain-wall-mediated ferroelectric switching. Nat Commun 4, 2791 (2013)

[6] M. Hadjimichael, Y. Li, E. Zatterin et al. Metal–ferroelectric supercrystals with periodically curved metallic layers. Nat. Mater. 20, 495 (2021)

[7] J.J.P Peters, A.M Sanchez, D. Walker et al., Quantitative High‐Dynamic‐Range Electron Diffraction of Polar Nanodomains in Pb2ScTaO6. Adv. Mater., 31, 1806498 (2019)


16:02 - 16:05

261 Brownian Tomography of Mesoporous Silica Nanoparticles

Dr Cesare De Pace1, Dr Paul Soto2, Prof Samuel Sanchez3, Dr Lorena Ruiz-Perez1, Prof Giuseppe Battaglia1,3
1UCL, London, United Kingdom. 2Aix-Marseille University, Marseille, France. 3Institute for Bioengineering of Catalunya (IBEC), Barcellona, Spain

Abstract Text

Mesoporous silica nanoparticles (MSNs) have raised significant interest in the last decades for their potential applications in various fields, due to their biocompatibility, tunable surface chemistry, and porosity. Porosity characteristically defines the properties of any mesoporous material and it is often studied by nitrogen sorption using the so-called Brunauer, Emmett, and Teller (BET) technique, and transmission electron microscopy (TEM). Herein, we propose the characterization of porosity in MSNs by means of Brownian tomography (BT), a 3D reconstruction method that takes advantage of the Brownian motion experienced by single MSNs when they are dispersed in liquid media. We have employed liquid-phase electron microscopy (LPEM) to image MSNs in an aqueous environment without the need for fixation or labeling. We complemented the BT investigations with dynamic light scattering (DLS), TEM, and BET. The reconstructed structures displayed average sizes and pore diameter of 30.7 ± 1.2 nm, and 2.4nm ± 0.7nm respectively in good agreement with BET and DLS. BT offered a precise, unbiased structural characterization of MSNs, and of their unique porous structure. This reconstruction technique has proved to be well suited for unveiling the unique architecture of novel nanostructured materials. 


Keywords

in situ TEM, liquid-phase electron microscopy, nanoparticles, Brownian tomography, 3D reconstructions

References


16:22 - 16:34

284 Heat Treatment of Steel: A Novel High Temperature In Situ SEM Imaging Approach.

Ms Rhiannon Heard
University of Oxford, Oxford, United Kingdom. Natural History Museum, London, United Kingdom

Abstract Text

Summary

The development of a new heat stage that can be used within a commercial Scanning Electron Microscope (SEM), has facilitated Electron Backscatter Diffraction (EBSD) and Secondary Electron (SE) imaging at temperatures up to 920 °C. The recent studies focus on the heat treatment of Steel and aim to demonstrate the effects of surface finish and oxidation on the ability to track surface microstructural changes, representative of the bulk of the specimen, at these temperatures in situ. The applications focus on evaluating grain growth, phase change and oxidation oxide formation of Steel using novel in situ thermal etching SE and EBSD imaging supplemented by other microscopy techniques. These unique observations document grain growth and phase transformation patterns, which provide in-sight into the microstructural changes that occur during heat treatment. Thus, the data enhances the understanding of the heat treatment process of Steel whilst highlighting the benefit of in situ high temperature testing for providing information on grain boundaries, crystallography and phase changes, as well as demonstrating the success of this new heat stage.    


Introduction

In situ high temperature SEM imaging enables observation and subsequent quantative and qualitative analysis of material microstructural behaviours. Recent development of a novel heat stage [1], has focussed on understanding how surface observations at high temperature, may represent the microstructural evolution within the bulk of the specimen.  Hence, this study demonstrates the parameters required to ensure the images captured using novel heat stages developed for experimental in situ high temperature SEM imaging are representative of the equivalent ex situ dynamic process. The results of the investigation are subsequently used to study the microstructural evolution, with respect to grain, phase and oxidation, during the heat treatment process of Carbon Steel. 


Method

Experiments were conducted using 0.4% carbon steel with imaging up to 920 °C capturing grain and phase developments during heat treatment. The high temperature SE and EBSD imaging was made possible owing to the use of a novel heat stage within a Zeiss EVO (E)SEM. From the SE images it was possible to track the grain growth and morphological transformation at temperature owing to a phenomenon known as thermal etching [2]. The SE data was further supplemented by high temperature EBSD data capture during the heat treatment. To support the in situ microstructure data gathered, chemically etched samples were imaged optically before and after heating and change in composition quantified.


Results & Discussion

The in situ high temperature thermal etching technique was used to study the microstructural evolution of Carbon Steel during normalising heat treatment. To ensure the surface data observed was representative of the bulk of the specimen, the microstructural evolution ex-situ after specimens underwent thermal etching was also considered for different temperatures. The grain growth ex-situ at the surface and bulk post a 4-hour heat treatment at 800, 850 and 920 °C indicate a negative correlation between temperature and surface grain growth, but a positive correlation between temperature and bulk grain growth. This is due to oxidation rate increasing with temperature where the oxidation pins the grain boundaries around the thermal etch on the surface, stalling grain growth, indicating surface may not always represent the bulk. However, oxidation is minimal when heating for 1 hour at 800 °C and thus in situ surface grain growth is representative of the bulk of the material. Therefore, for heat treatments of Carbon Steel which were less than 1 hour at 800 °C, in situ SE and EBSD data was used to quantify grain growth and phase transformation. Calculating in situ grain growth indicated abnormal linear grain growth occurred, which may be due to some remaining ferrite grains shrinking as austenite grows [3]. Phase change data suggested the formation of the austenite phase during heat treatment from a ferrite/pearlite starting structure occurs by a combination of nucleation and growth with initial transformation of the pearlite phase followed by the ferrite. The SE data was supported by EBSD phase change data. For higher temperatures, oxidation during heat treatment was tracked, where the SE in situ observations provided insight into the morphological formation of surface oxidation during heat treatment of Carbon Steel [4].

Conclusion 

In situ high temperature imaging is highly beneficial in tracking and quantifying changes in phase and microstructure but is affected by surface finish and oxidation. The data shown here provides insight into the effect of heat treatments on the bulk verses surface of a material and how sample preparation and atmosphere can impact this. However, if oxidation on the surface is limited, thermal etching SE results demonstrate an alternative technique to monitor changes in microstructure in situ at temperature. Finally, the data establishes the ability of the new stage to image at temperature and the benefits of capturing microstructural evolution in real time during heat treatment processes.   

Uncaptioned visual

Figure: (a) heat stage in situ, (b) EBSD Inverse Pole Figure Map of Carbon Steel  pre heat treatment and at 800 °C, (c) EBSD Phase Map of Carbon Steel  pre heat treatment  and at 800 °C, (d) EBSD Inverse Pole Figure Map of Carbon Steel  post heat treatment, (e) SE high temperature images of Carbon Steel  at 920 °C at regular intervals up to 1 hour, (f) SE high temperature images of Carbon Steel  at 800 °C after 5 minutes of heating and 20 minutes and (g) EDX compositional map post heat treatment of Carbon Steel where green is Iron and Yellow is Oxygen.  

Keywords

Carbon Steel

Heat Treatment

SEM

In Situ

Oxidation

Phase Transformation 

Grain Growth

References

  [1]      E. W.-B. and K. D. Rhiannon Heard, John E. Huber, Clive Siviour, Gary Edwards, “An investigation into experimental in-situ SEM imaging at high temperature.,” Rev. Sci. Instrum., 2020.

[2]        W. W. Mullins, “Theory of Thermal Grooving,” vol. 333, no. 1957, 1986, doi: 10.1063/1.1722742.

[3]        R. HEARD, K. I. DRAGNEVSKI, and C. R. SIVIOUR, “In‐situ SEM observation of grain growth in the austenitic region of carbon steel using thermal etching,” J. Microsc., p. jmi.12894, Apr. 2020, doi: 10.1111/jmi.12894.

[4]        R. Heard, C. R. Siviour, and K. I. Dragnevski, “In situ SEM analysis of surface oxidation mechanisms in carbon steel during vacuum heat treatment,” Mater. Today Proc., Jun. 2020, doi: 10.1016/j.matpr.2020.05.396.


16:34 - 16:37

14 Introducing the term “probe high tension” and extreme x-ray collection efficiency on Spectra Ultra S/TEM

Dr. Anil Yalcin
Thermo Fisher Scientific, Eindhoven, Netherlands

Abstract Text

Besides being the first commercial platform with corrector(s), first generation Titan was capable of high tension range from 300 kV down to 80 kV. For improved optical and specimen stability, bifilar coil design was introduced in the objective lens unit [1], enabling swift mode switches at a certain high tension operation. Overnight high tension switches have become the norm, and since then, market expectations have moved forward that current S/TEMs have a high tension range down to 30 kV with stability achieved over a couple of hours. This timescale can be seen long in some cases, for instance, S/TEMs shared by several multi-disciplinary research groups.

Research community has also driven the market in terms of x-ray collection efficiency and output count rate maximization in elemental studies. Lithium doped silicon (Si(Li)) EDS detectors were replaced with silicon drift detectors (SDDs) and Super-X became the first EDS detection system with multiple SDDs on a S/TEM [2]. Growing beam sensitive materials research field and time to data considerations have brought solid angles to around 2 sr and output count rates to 1 million cps. 

Recent advances in R&D allow us to introduce a new platform within the Spectra portfolio, which will address the above mentioned market demands in full. This new member, Spectra Ultra S/TEM, is equipped with an EDS detection system allowing unshadowed solid angle of above 4 sr without any compromise in terms of spatial resolution (i.e. larger pole piece). Moreover, Spectra Ultra S/TEM can stabilize within minutes after a high tension switch, whereby introducing the term “probe high tension” to the TEM community. In this way, one can now use high tension as an experiment variable similar to changing probe current or convergence angle in microscope operation.

We believe that Spectra Ultra S/TEM will further accelerate research in beam sensitive materials. Thanks to the unprecedented x-ray collection efficiency, extreme low doses can now be used to generate high quality elemental maps. Furthermore, depending on the specimen behavior under the electron beam, probe high tension can be tuned as often as needed for experiment optimization.

Keywords

Solid angle, beam sensitive specimens, low dose imaging, high tension flexibility

References

[1] van der Stam, M. et al. Microsc. Microanal., 2005, 19, 9-11.

[2] Schlossmacher, P. et al. Microsc. Microanal., 2010, 24, S5-S8.


16:37 - 16:40

258 Caught in transition: Nanoscale analysis and molecular level characterisation of collagen mineralisation by complementary use of electron microscopy and in situ Raman microspectroscopy

Emma Tong1, Professor Roland Kroger1, Dr Brian Wingender2, Professor Laurie Gower3, Dr Julia Parker4
1University of York, York, United Kingdom. 2University of North Florida, Jacksonville, USA. 3University of Florida, Florida, USA. 4Diamond Light Source, Oxford, United Kingdom

Abstract Text

Bone is a fascinating and critically important biocomposite combining hardness and toughness through its hierarchical organisation facilitated by the nano-level organisation of an inorganic mineral [1], hydroxyapatite (HAp), and a protein, collagen type I, along with a minor fraction of non-collagenous proteins (NCP’s) and polysaccharides that affect the bone formation process largely due to their calcium binding potential. Despite intensive research the mechanism behind the mineralisation of the collagen matrix constituted of fibrils with approximately 100 nm diameter, is still a central problem in the field of bone research. Current understanding is that the mineral formation occurs via an amorphous precursor phase that infiltrates the collagen fibrils and subsequently crystallises [2, 3] However, the fundamental details of collagen infiltration and crystal growth remain controversial. A key problem is the understanding of the infiltration and mineralisation dynamics which we addressed by using ex situ transmission electron microscopy (TEM) in conjunction with electron diffraction for high-resolution analysis of the mineral complemented by novel in situ Raman microspectroscopy providing insights into the molecular level transport and transformation processes of the phosphate precursor phases. This approach allowed us to study the time dependence of precursor transport, intermediate phase formation and subsequent mineral growth using a model system of collagen mineralisation, namely the polymer induced liquid precursor (PILP) method. Our studies show that both intrafibrillar and extrafibrillar mineralisation occurs via an amorphous calcium phosphate (ACP) as most likely octacalcium phosphate (OCP) to HAp transformation in a time frame of approximately two hours whereas the complete mineralisation of collagen happened over a period of nine hours. Hence a rapid mineral phase transformation precedes the subsequent slower mineral growth process.

In order to identify the molecular level processes involved in the precursor transport and phase transformation, we have used an in vitro model system, the PILP process, by which collagen is mineralised in both intra- and extra-fibrillar spaces [2]. This leads to a nanostructural organisation that emulates key aspects of bone formation. Our in vitro model system employs a process-directing polymer as a biogenic analogue to the NCP’s found in native bone formation. Using a bespoke in situ heated liquid cell to maintain physiological temperatures within a Raman spectrometer, we have examined collagen mineralisation in real time, and observed peak development indicative of the transition from an amorphous precursor phase, ACP/OCP through to the formation of hydroxyapatite (HAp) crystals (Figure 1).

Uncaptioned visual

Figure 1. Time-resolved Raman spectra showing PO4 peak shift and evolution. The spectra highlighted in red shows the first stages of nucleation. The series of spectra highlighted in blue show the transformation from ACP/OCP to HAp. The black spectra show the increase of intensity in the PO4 peak indicating continuous transformation and growth of HAp crystals.   


Furthermore, the kinetics and mechanisms of the transformation from ACP/OCP to HAp was studied using the Avrami model assuming that the fraction of mineralisation is given by                                                                          

Φ = 1 − exp (−ktⁿ )                                          Eq.1

where the parameter k gives information on nucleation density and growth rates and n provides information on the dimensionality of the growth and the possible impact of diffusion. Observations show that the goodness of fit is satisfactory indicating that the transformation process follows Avrami type kinetics. We see a peak shift at approximately 1 hour indicating the transition between precursor phases (ACP/OCP) to HAp (Figure 2a). The derivative shows the maximum rate of transformation from ACP/OCP to HAp is at 4 hours (Figure 2b) whereas the transition phases can be observed at 1 hour indicating a rapid transformation to a mineral phase. 

Uncaptioned visual

Figure 2. a) Time-resolved data showing the shift of the PO4 peak position. A sharp shift in the peak position from ACP942-948/OCP956 can be observed at approximately 1 hour. The peak of the position shifts again at approximately 1.5-2 hours from OCP956 to HAp958 where the peak position reaches a plateau once mineralisation has occurred. b) The derivative shows the maximum rate of transformation from ACP/OCP to HAp is at 4 hours. 


Based on the values that Wong and Czernuszka give of n > 3 to either zero nucleation (n = 3), decreasing nucleation rate (n = 3–4), or constant nucleation rate (n = 4) for solvent mediated re-dissolution and re-crystallization processes [4]. Values below 3 indicate diffusion-controlled growth. Observations in the data (k = 0.014995 n = 2.5534) indicate a diffusion-controlled growth followed by a rapid and constant nucleation crystal growth. 

A detailed analysis of the resulting mineralised collagen was performed by TEM. Bright field TEM (BFTEM) images show densely packed, aligned collagen fibrils (Figure 3a). The characteristic d-banding of the collagen fibrils (indicative of the periodic arrangement of the gap- and overlap regions within the collagen fibres) can be clearly observed (Figure 3a). TEM images and selected area electron diffraction (SAED) patterns (Fig. 3a and 3b) are consistent with those for hydroxyapatite crystals. The (002) and the (004) reflection arcs can be observed in the diffraction patterns indicating that the [001] c-axis of the HAp crystals are roughly aligned with the collagen fibril axis within an angular range of approx. ±20˚ (Fig. 3b).

Uncaptioned visual

Figure 3. a) BFTEM image of mineralised collagen fibre. b) Selected area diffraction pattern of mineralised collagen showing the (002) and (004) reflection arc.


Furthermore, the BFTEM images revealed the coexistence of two crystal morphologies, platelet and needle like in shape (Fig. 4a and 4b).

Uncaptioned visualFigure 4. a) BFTEM image of a mineralised collagen fibre showing the coexistence of two crystal morphologies. b) The characteristic collagen D- banding can be seen. 


Our findings indicate that we can observe both intrafibrillar and extrafibrillar mineralisation akin to that observed in native bone. We have shown that using the Avrami model we can further study the kinetics of transformation during the mineralisation process. This work further allows for the quantitative characterisation of the kinetics of precursor infiltration and crystallisation, which are strongly dependent on the choice of polymer used for calcium and phosphate transport and opens up new avenues for a full understanding of bone mineralisation.


Keywords

Biomineralisation Collagen PILP Electron Microscopy Raman Spectroscopy 

References

  • Reznikov, N., Bilton, M., Lari, L., Stevens, MM., Kroger, R. (2018). Fractal-like hierarchical organization of bone begins at the nanoscale. Science, 360. 
  • Gower, LB. (2008). Biomimetic Model Systems for Investigating the Amorphous Precursor Pathway and Its Role in Biomineralization. Chemical Reviews, 108 (11), 4551-4627. 
  • Olszta, M., Cheng, XG., Jee, SS., Kumar, R., Kim, YY., Kaufman, MJ., Douglas, EP., Gower, LB. (2007). Bone structure and Formation: A new perspective. Materials Science and Engineering, 58 (3-5), 77-116. https://doi.org/10.1016/j.mser.2007.05.001.
  • Wong, ATC and Czernuszka, JT. (1993). Transformation behaviour of calcium phosphate 1. Theory and modelling. Colloids and Surfaces A: Physiochemical and Engineering Aspects, 78, 245-253.