Correlative Microscopy Across the Scales

15:00 - 17:20 Thursday, 24th June, 2021

Tracks Meeting Session

Session Chair Julia Fernandez-Rodriguez

Combining different imaging modalities can generate more or better data than by utilising each modality as stand alone. It is a holistic approach that spans the entire resolution range from nano- to millimeters, and provides complementary information about structure, function, dynamics and molecular composition of the sample. The combination of light microscopy with TEM is well established (generally referred to as CLEM). Other modalities are however more and more integrated in correlative workflows. This can be in completely cryo mode to visualise molecular details but also using large scale imaging techniques such as light sheet, X-ray and Volume SEM to study intercellular relationships. Abstracts are encouraged in and around this area.


15:00 - 15:25

93 From colors to grayscale: illuminating the way to the nanometer world

Anna Steyer
EMBL Heidelberg

Abstract Text

Correlative light and electron microscopy (CLEM) experiments uniquely provide a highly accurate link between the imaging of living cells and their 3D ultrastructure. However, CLEM generally suffers from a low throughput. The major hurdles include tracking the object throughout the different imaging modalities, the tedious procedures for sample preparation and the lack of automation in the data acquisition by electron microscopy. In recent years, Focused Ion Beam Scanning Electron Microscopy (FIB-SEM) has emerged as a flexible method that enables semi-automated volume acquisition at the ultrastructural level. We present a toolset for adherent cultured cells that enables tracking and finding cell regions previously identified in light microscopy, in the FIB-SEM along with automatic acquisition of high-resolution volume datasets. The automation of the workflow includes setting the coincidence point of both ion and electron beams, automated evaluation of the image quality and constantly tracking the sample position with the microscope’s field of view reducing or even eliminating operator supervision. The approach enables to target the regions of interest in EM within 5 μm accuracy, while iterating between different targets including unattended data acquisition. This allows to collect statistically significant data from a large number of cells in a heterogeneous population, demonstrating that executing high throughput volume acquisition in electron microscopy is feasible.


15:30 - 15:42

37 Multimodal and multicolour microscopy to identify biomolecules in large-scale electron microscopy

Pascal de Boer1, Aditi Srinivasa Raja2, Jacop P. Hoogenboom2, Ben N.G. Giepmans1
1Department of Biomedical Sciences of Cells and Systems, University Medical Center Groningen, The Netherlands. 2Deptartment of Imaging Physics, Delft University of Technology, The Netherlands

Abstract Text

Electron microscopy (EM) is a powerful tool for imaging biomolecules at near-molecular resolution in cells and tissue, which is essential to understand the regulation of life and disease. However, restricted fields of view (FOVs) at high resolution hamper the quantitative power of EM. We routinely perform large-scale 2D EM on complete cells and tissue sections to maintain both large FOVs and high resolution, called nanotomy for nano-anatomy (www.nanotomy.org). Multiple disease and tissue specific databases are being created as a resource for biomedical EM data for researchers worldwide. This includes our recently published repository for the study of type 1 diabetes containing zoomable datasets of pancreatic tissue from over fifty donors [1]. However, identifying specific molecules in such large grey-scaled datasets is troublesome. Therefore we optimized and routinely apply energy dispersive X-ray analysis (EDX) for nanometer resolution elemental fingerprinting on bio-samples [2,3]. EDX-based ‘colorEM’ allows identification of elemental enriched probes as well as endogenously present elements (figure 1). Furthermore, with correlated light and electron microscopy (CLEM) multimodal fluorescent and EM labels show specific  biomolecules in a high resolution context [4]. Though, targeting, spectral variety, and registration are often limited. Therefore, to better identify proteins of interest, we now develop a super-resolution fluorescence technique for integrated CLEM called electron beam-induced super resolution microscopy (eSRM): fluorescence signals are recorded during scanning of the focused electron beam, local modifications of the signal by the electron beam allow localization of fluorescence molecules with improved resolution (figure 2). However, novel probes are required since fluorescence of current available probes fade away in the EM vacuum during integrated CLEM, or quench upon EM sample preparation. Therefore, fluorescent proteins were optimized for high fluorescence yield in vacuum, either stability or lability under electron irradiation, and compatibility with EM sample preparation. This resulted in several candidate probes with both high vacuum quantum yield and fluorescence retention in EM samples. Thus, the quantitative power of EM is improved by nanotomy in combination with analytical EM and optimized CLEM methods. 

Uncaptioned visual

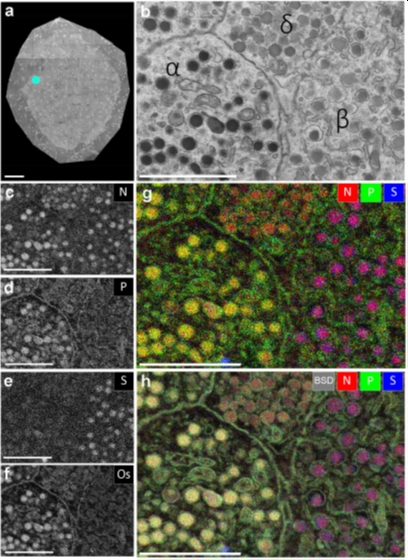
Figure 1. EDX defines cell-types and subcellular structures in nanotomy maps. (a) nanotomy overview of a rat islet of Langerhans. (b) Area of interest (indicated in a; cyan dot) shows four cells with different granules based on grey levels and morphology. (c-f) Elemental content in the ROI for nitrogen (N), phosphorus (P), sulfur (S), and osmium (Os). (g) Overlay of N (red), P (green), and S (blue) allows identification of cells and granules. (h) Overlay of back scatter ICD image (BSD, grey) over the color-image of g. Bars: 50 µm (a) and 2 µm (b-h). This figure is adapted from [2].

Uncaptioned visual

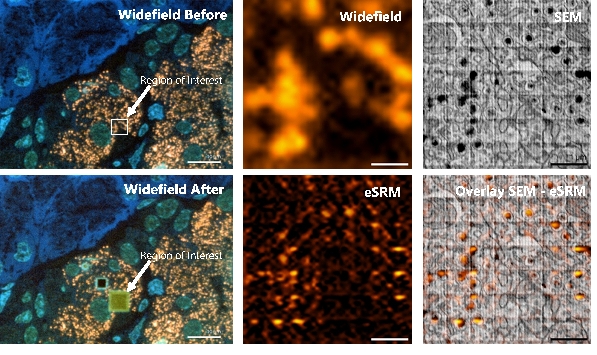
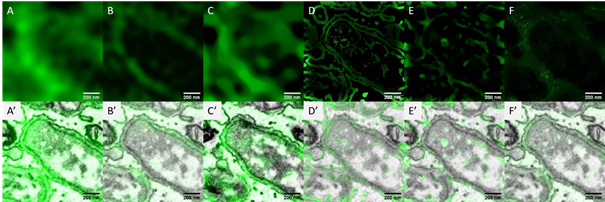
Figure 2. Electron beam-induced super resolution microscopy (eSRM). (a) Post-embedding immunolabeling of insulin on an ultrathin rat pancreas section using alexa fluor 594 (orange), with the region of interest (ROI) depicted. (b) Widefield fluorescence image of ROI. (c) SEM image of the ultrastructure of the ROI revealing single insulin granules (black cores). (d) Image after the eSRM protocol, showing the bleached ROI. (e) The same ROI as in b after the eSRM protocol. (f) The eSRM image from e overlaid on the SEM image of c. Bars: 10 µm (a, d) and 1 µm (b-c, e-f). 


References

[1] de Boer et al., Nature Communications, 11, 2475-020-16287-5, 2020

[2] Scotuzzi et al., Scientific Reports, 7,7:45970, 2017

[3] Pirozzi et al., Histochemistry and Cell Biology, 150(5):509-520, 2018

[4] de Boer et al., Nature Methods, 12(6):503-13, 2015


15:42 - 15:54

41 Guided- Deconvolution in Correlative Light and Electron Microscopy

Fengjiao Ma1,2,3, Sedzicki Jaroslaw4, Stephanie Hoeppener5,3, Christoph Dehio4, Rainer Heintzmann1,2,3
1Institute of Physical Chemistry and Abbe Center of Photonics, Friedrich Schiller University Jena, Jena, Germany. 2Leibniz Institute of Photonic Technology, Jena, Germany. 3Jena Center for Soft Matter (JCSM), Friedrich Schiller University Jena, Jena, Germany. 4Biozentrum, University of Basel, 4056 Basel, Switzerland. 5Organic and Macromolecular Chemistry (IOMC), Friedrich Schiller University Jena, Jena, Germany

Abstract Text

This project is aimed at investigating optimized approaches to obtain molecule specific information by the (fluorescence) light microscopy (LM) measurement and to join it with the ultra-structure seen in its correlated the electron microscopy (EM) images.


Correlative light and electron microscopy is popular for investigating the internal structure of cells[1,2] By specific labeling of the proteins of interest, one can easily study their role in the cell. However, even with current super resolution microscope technology, ultra-structural detail in the cell is still difficult to discern in light microscopy. The use of the electron microscopy enables to further observe the cell's microstructure down to the nanoscale level. However, transmission electron microscopy's low and relatively unspecific contrast makes it difficult to conclude on the role of individual molecules.


We implement a customized algorithm to enable an EM-guided deconvolution, which can automatically recognize the LM labeled structures in and EM image. This will, for example, help the study of changes in the ultrastructural environment in response to nanoparticle uptake. We demonstrate that our EM-guided deconvolution of light microscopy images, achieves better results than state of the art regularized deconvolution [3] of LM data only (Fig.1). Both, simulated and experimental results will be presented.

 Uncaptioned visual

Figure 1: A comparison of the measured light microscopy image and the deconvolution reconstruction results. The image shows the GFP labeled endoplasmic reticulum (ER) when the facultative intracellular pathogen Brucella enter into host cells [4]. A) measured wide field fluorescence light microscopy image; B) structure illumination microscopy[5] image; C)-F) the restored images of (A) using the modified total variation deconvolution, the entropy-based intensity-guided deconvolution, the modified total variation deconvolution combining intensity-guided deconvolution and the gradient-guided deconvolution. A’) – F’) the overlay of the measured / restored images and the electron microscopy image. The restored imaged from the EM-guided deconvolution (D-F) represent more details about the ER membranes than both the regularized deconvolution (C) and the super resolution light microscopy image (B).


References

[1] Jahn, K. A., et al. "Correlative microscopy: providing new understanding in the biomedical and plant sciences." Micron 43.5 (2012), 565-582.

[2] Ando, Toshio, et al. "The 2018 correlative microscopy techniques roadmap." Journal of physics D: Applied physics 51.44 (2018), 443001.

[3] Soulez, Ferréol, et al. "Blind deconvolution of 3D data in wide field fluorescence microscopy." 2012 9th IEEE International Symposium on Biomedical Imaging (ISBI). IEEE, 2012.

[4] Sedzicki, Jaroslaw, et al. "3D correlative electron microscopy reveals continuity of Brucella-containing vacuoles with the endoplasmic reticulum." Journal of cell science 131.4 (2018).

[5] Jost, Aurélie, and Rainer Heintzmann. "Superresolution multidimensional imaging with structured illumination microscopy." Annual Review of Materials Research 43 (2013), 261-282.


16:10 - 16:22

54 Combining Tip-Scanning AFM with Super-Resolution Optical Imaging towards Multiparametric Correlative Microscopy

Dimitar R Stamov1, Tanja Neumann1, Ana I Gómez-Varela2, Adelaide Miranda3, Pieter A A De Beule3, Heiko Haschke1
1JPK BioAFM, Bruker Nano GmbH, Berlin, Germany. 2Department of Applied Physics, University of Santiago de Compostela, Spain. 3International Iberian Nanotechnology Laboratory, Braga, Portugal

Abstract Text

The last three decades have established atomic force microscopy (AFM) as an indispensable tool for high-resolution structural analysis of specimens ranging from single molecules to complex biological systems [1]. AFM currently offers premium spatial resolution of the analysed samples while simultaneously being able to correlate topography and mechanics at near native/physiological imaging conditions. In turn, the combination with advanced/customised optics leverages the advantages of immunolabelling techniques for truly correlative microscopy. Recording the stimulated emission depletion (STED) microscopy fluorescence delivers a multi-colour image with a spatial resolution 6-10 times enhanced relative to conventional optical methods and, therefore, reach the same order of magnitude as the spatial resolution of the AFM [2]. Furthermore, structured illumination microscopy (SIM) offers a unique possibility to go below the optical diffraction limit, while simultaneously operating and acquiring AFM images [3].

We will demonstrate how AFM imaging and super-resolution 2color easy3D STED measurements can be combined and show results on the co-localized imaging and sample manipulation with a precision far below the diffraction limit. This can be applied for comprehensive investigation of biological samples and allow for immunological assignment of the high-resolution cytoskeletal filaments in living fibroblasts. The mechanical stimulation of microtubules and actin filaments with AFM in living cells while performing STED experiments will be presented. We will also show examples of the accuracy of registering/overlay the AFM and optical images on commercially available DNA origami structures with dimensions below the diffraction limit.

Correlating data from different microscopy techniques holds the potential to discover new facets of signalling events in cellular biology. We have recently demonstrated for a first time a hardware set-up capable of achieving simultaneous co-localized imaging of spatially correlated far-field super-resolution fluorescence microscopy and AFM [4]. We will demonstrate the system performance using sub-resolution fluorescent beads, and a test sample consisting of human bone osteosarcoma epithelial cells, with plasma membrane transporter 1 (MCT1).

[1]          M. W. Amrein and D. Stamov, ‘Atomic Force Microscopy in the Life Sciences’, in Springer Handbook of Microscopy, P. W. Hawkes and J. C. H. Spence, 2019, pp. 1469–1505.

[2]          B. Harke et al., Opt. Nanoscopy 1 (1), p. 3, 2012.

[3]          A. Miranda et al., Nanoscale 13 (4), pp. 2082–2099, 2021.

[4]          A. I. Gómez-Varela et al., Sci. Rep. 10 (1), p. 1122, 2020.


References


16:22 - 16:34

58 Introducing the EMBL Imaging Centre

Timo Zimmermann, Judith Weber
European Molecular Biology Laboratory

Abstract Text

The rapid technological developments of the last two decades have led the scientific community to achieve biological and medical discoveries at an ever-increasing pace. Outstanding advances in imaging technologies such as electron and light microscopy enabled us to directly visualise the molecular machinery of life at an unprecedented level of detail. Cutting-edge microscopy is therefore becoming a central technology platform for life sciences. However, at present, only a minority of scientists have access to the latest imaging technologies as the devices are not only expensive, but also complex in their set-up, maintenance and usage.

The EMBL Imaging Centre represents a new service unit at the European Molecular Biology Laboratory (EMBL) in Heidelberg, Germany. Located in a new state-of-the-art building that was finished in spring 2021 and starting operation in summer 2021, the EMBL Imaging Centre provides access to the highest resolution electron (EM) and light microscopy (LM) technologies, including academically developed methods that are not yet commercially available. The main mission of the EMBL Imaging Centre is to rapidly make the most advanced microscopy technologies available to the broad scientific international user community from both academia and industry. A powerful and synergistic portfolio of imaging technologies will be offered both individually and in a combined (correlative) fashion, to enable new ground-breaking research that crosses the scales of biology.

LM technologies will cover all scales from the latest (cryo-)super-resolution technologies to high-speed and high resolution live-cell, as well as intravital and deep tissue imaging, with a focus on non-commercial, academically developed technologies.

EM technologies housed in the EMBL Imaging Centre will cover all scales from single-particle cryo-electron microscopy and cryo-tomography to (cryo-)CLEM and cellular/tissue volume electron microscopy.

Upon full operation the EMBL Imaging Centre will provide access to users, support their projects from sample preparation to image analysis with expert staff, and will offer tailored training opportunities.


16:34 - 16:59

100 Segmentation Enables Automated Registration for CLEM

John Bogovic
HHMI, Janelia Research Campus

Abstract Text

Automatic registration of light and electron microscopic images poses a difficult challenge due to resolution and contrast differences between the modalities, and the potentially non-linear transformations induced during sample preparation. We manually labeled 35 classes of cellular substructures across a variety of cell types to train deep neural networks for automatic organelle segmentation. This both enables structural / biological analyses and makes possible automated image registration. We generate synthetic images derived from the EM segmentation that resemble light images of fluorescent organelle markers, suitable for automatic pixel-based deformable registration algorithms.

We develop open source software tools and algorithms to enable high throughput analyses. We contribute to community efforts to create scalable and flexible computational infrastructure for these challenging tasks. These efforts include: ImageJ/Fiji, Imglib2, Bigdataviewer, BigWarp, N5, Paintera, and Elastix.


17:04 - 17:07

28 Application of low-cost stochastic optical reconstruction microscopy to the histological analysis of human glomerular disease

Edwin Garcia1, Jonathan Lightly1, Sunil Kumar1,2, Ranjan Kalita1, Frederik Görlitz1, Yuriy Alexandrov1,2, Terence Cook1, Christopher Dunsby1,2, Mark Neil1,2, Candice Roufosse1, Paul French1,2
1Imperial College London. 2Francis Crick Institute

Abstract Text

Summary

Electron microscopy (EM) is used for diagnosis in human glomerular diseases in the UK and elsewhere but diagnostic EM is not available in many countries. Single molecule localisation microscopy (SMLM) can extend conventional immunofluorescence of stained tissue to resolution near EM. We are exploring the diagnostic value of easySTORM, our low-cost implementation of dSTORM, applied to standard histological sections of frozen and paraffin-embedded clinical kidney samples. 

Introduction

Electron microscopy (EM) following immunofluorescence (IF) imaging is established in the UK for the diagnosis of human glomerular diseases but the implementation of EM is limited to specialised institutions and it is not available in many countries. We have applied easySTORM [1] , our low-cost implementation of dSTORM [2] to upgrade a standard widefield fluorescence microscope to provide immunofluorescence images with resolution below 50 nm starting from standard histological sections from human kidney biopsies - both frozen and formalin-fixed and paraffin-embedded (FFPE) – to explore whether this may provide an alternative to EM for diagnosing kidney disease. We have developed a workflow that we designate “histoSTORM”, utilising clinically approved immunofluorescent probes for the basal laminae and immunoglobulin G deposits and have compared this approach to clinical electron microscopy images. We demonstrate enhanced imaging compared to conventional immunofluorescence microscopy for cases of membranous glomerulonephritis, thin basement membrane lesion and lupus nephritis. Thus minor modifications of established immunofluorescence protocols for clinical renal biopsies may enable a cost-effective alternative to EM to aid diagnosis of human glomerular disease.  

Methods

“histoSTORM”: immunofluorescence staining was carried out on frozen and formalin-fixed paraffin embedded (FFPE) tissue from renal biopsies with Membranous glomerulonephritis (MGN), Lupus nephritis and Minimal change disease. Staining was performed for IgG documented with ifluor 647 and for Glomerular Basement Membrane (GBM) laminin documented with Alexa Fluor 555 using antibodies in routine clinical use. dSTORM of these tissue sections was undertaken using our open source easySTORM adaptation of a conventional fluorescence microscope.

“histoSTORM” was applied to immunofluorescence of both FFPE and frozen histological sections using standard clinically approved antibodies. The super-resolved immunofluorescence images rendered at 25 nm per pixel reveal well-defined subepithelial deposits in MGN and enlargement of the GBM that are consistent with those observed by EM. In a case of stage IV lupus nephritis, mesangial, subendothelial and subepithelial IgG deposits are readily observed with histoSTORM and recapitulate the distribution of electron dense IgG deposits documented with EM. histoSTORM also enables GBM thickness measurements on paraffin-embedded tissue with resolution below diffraction in a case of Minimal change disease.

Uncaptioned visual

A-I: Basement membrane (laminin, green – Alexa Fluor 555), Immunoglobulin G deposits (IgG, red – iFluor 647). A-B. Widefield immunofluorescence images at 20x magnification of frozen section of Membranous Glomerulonephritis showing A: laminin channel, 
B: IgG channel, and C: expanded two-channel image at 100X magnification of region indicated by yellow square in A and B; 
D: Widefield immunofluorescence of region indicated by yellow square in C; and 
E: corresponding STORM image with pixel size rendered at 25 nm. 
F:  Electron micrograph of similar structure from same biopsy at 20,200x magnification. 
G: Widefield immunofluorescence image of 3.2 x 2.4 µm2 region indicated in D,E with H: corresponding STORM image; 
I: expanded electron micrograph image of region indicated in F. Yellow dashed lines indicate the light grey glomerular basement membrane. Dark grey electron-dense deposits on the sub-epithelial side (purple arrows) represent immune complexes containing IgG.

J-P: Glomerular Basement Membrane (Laminin-iFluor 647) 
J: Widefield immunofluorescence image at 100x magnification of FFPE section 
K: Rendered STORM image of region shown in J. L: Widefield inset of a region shown in J. M: STORM inset of region shown in K rendered with a pixel size of 25 nm. 
N: Electron micrograph of a GBM from different section of same biopsy 60,700x magnification, for which the GBM thickness at indicated position is 281 nm. 
O: Presenting measured thickness (full width at half maximum) of GBM from wide-field immunofluorescence image C line profile (657 nm)  
P:  Measured thickness (FWHM) of STORM image M at line profile (212 nm).

Figure adapted from reference [3]. 


Conclusions

While this study [3] does not establish that histoSTORM can fully replace EM in renal diagnosis, it does provide evidence of added value relative to Light Microscopy and IF. The large (dSTORM) field of view (120 µm square) and standard sample preparation make it more convenient than EM (as well as more affordable). However, prospective studies of large case series are required to establish its clinical utility. histoSTORM may not be able to replace EM for all renal diagnoses but it may have potential for wide clinical impact, especially in less well-resourced settings where EM is not available. We note that STORM has previously been applied to research pathology, e.g. to study epigenetic modulation [4] and the progression of cancer [5] but not to clinical histological sections using clinically approved antibodies, to the best of our knowledge. 


References

[1] Kwakwa, K., et al.,. “easySTORM: a robust, lower-cost approach to localisation and TIRF microscopy,” J. Biophotonics, 9, 948–957 (2016).

 [2] Heilemann, M., et al.,  Subdiffraction-resolution fluorescence imaging with conventional fluorescent probes. Angewandte Chemie (International Ed. in English), 47, 6172–6176 (2008)

 [3] E. Garcia et al., “Application of direct Stochastic optical reconstruction microscopy to the histological analysis of human glomerular disease”, J Pathology: Clinical Research, in press

[4]  Xu J, Ma H, et al., Super-Resolution Imaging of Higher-Order Chromatin Structures at Different Epigenomic States in Single Mammalian Cells. Cell Reports 24 (2018) 873-882.

[5]  Xu J, et al., Super-resolution imaging reveals the evolution of higher-order chromatin folding in early carcinogenesis. Nature Communications 11 (2020) 1899.


17:07 - 17:10

72 Organelle topology is a new breast cancer cell classifier

Ling Wang1, Joshua Goldwag1, Megan Bouyea1, Jamie Ward1, Niva Maharjan2, Amina Eladdadi2, Margarida Barroso1
1Albany Medical College. 2The College of Saint Rose

Abstract Text

Breast cancer is a highly heterogeneous disease, both phenotypically and genetically. The spatial organization of organelles is closely linked to their biological functions, yet our understanding of higher order intracellular organization is incomplete. Here, we sought to classify breast cancer cell lines based on the spatial context of organelles within cells, specifically their subcellular location and topological inter-organelle relationships. We have introduced a novel approach that quantifies, for the first time, the topological features of subcellular organelles, removing the bias of visual interpretation, to classify different breast cancer cell lines. This method was tested on three different organelle datasets: mitochondria (Mito), early endosomes (EEC) and endosome recycling compartment (ERC) in a panel of human breast cancer cells, and non-cancerous mammary epithelial cells. A morphometric evaluation of EEC, ERC and Mito resulted in 34 topology and morphology parameters. Application of Random Forest machine learning (ML) to 18 of these 34 parameters generated the highest accuracy in breast cancer cell classification. We systematically evaluated how different parameter combinations affected the machine learning-based cancer cell classification and discovered that topology parameters were crucial to achieve a classification accuracy over 95% of human breast cancer cell lines of differing subtype and aggressiveness. These findings lay the groundwork for using quantitative topological organelle features as an effective method to analyze and classify breast cancer cell phenotypes.

Organelle compartments as the cellular proteome are highly regulated in a spatiotemporally manner. However, advanced understanding on the cellular distribution of a network of organelle compartments, i.e. organelle topology, is lacking.  Here, we present OTCCP (Organelle Topology-based Cell Classification Pipeline), using ML-based method for the classification of breast cancer cell lines. To overcome the above limitations and lay the foundation for future cell recognition and diagnostics based on single cell analysis, OTCCP encompasses three major steps: (1) images were obtained by Airyscan high resolution microscopy at subcellular level and 3D rendered; (2) topology features for hundreds of organelle objects per cell were calculated; and (3) cell classification based on topology features was carried using ML algorithm. OTCCP was applied to three common organelles EEC using anti-EEA1 immunostaining, ERC using fluorescently labeled transferrin and Mito using anti-TOM20 immunostaining among six breast cancer cell lines MCF10A, AU565, MDA-MB-231 (MDA231), MDA-MB-436 (MDA436), MDA-MB-468 (MDA468), AU565 and T47D. These three different organelle topology datasets were tested using the same algorithm pipeline, outperforming topology and morphology-based methods. Based on the spatial distribution of organelles, i.e. distance from neighbor organelles (topology), a ML-based classification accuracy over 95% was achieved to discriminate between several human breast cancer cell lines of differing subtype and aggressiveness. 


Here, we have defined organelle networks by their organelle topology, i.e. the connectivity and spatial distribution as determined using the distance between each organelle object and all of its neighbors. OTCCP obtained the highest classification accuracy for organelle datasets using NDPG: 92.4% (Mito), 95.9% (ERC), and 97.1% (EEC). Using all 34 parameters (ONDPG), OTCCP displayed reduced classification accuracy at 90.7% (Mito), 94.0% (ERC), and 95.8% (EEC). OTCCP obtained the lowest classification accuracy 51.7% (Mito), 57.1% (ERC), and 60.8% (EEC) using OPG. From highest to lowest, classification accuracy ranking is: NDPG > ONDPG > DPG > ODPG > ONPG > NPG > OPG. Among the three organelles, when 7 different parameter groups were used in the classification tasks, EEC datasets always showed the highest classification accuracy comparing to the other two organelle datasets. Mito datasets always showed the lowest accuracy.


We confirmed the importance of cellular and nuclear morphology in breast cancer cells heterogeneity in using OTCCP. Furthermore, we demonstrated that organelle topology is more important than organelle and cell morphology in the classification of breast cancer cells. Importantly, three different organelle network datasets show consistent results in their ability to classify different breast cancer lines with high accuracy. These results suggest that EEC due to their puncta nature are ideal for cell classification. We also found that positioning of endosomes and distance between endosome objects across the cell is established for each cell in a regulated manner. Thus, reinforcing our principle that organelle’s spatial distribution (topology) plays a key role in breast cancer cell classification. This notion was also confirmed by the importance index ranking, in which topology-based parameters are dominant in the top 10 parameters. These findings lay the groundwork for using organelle profiling as a potentially fast and efficient method for phenotyping breast cancer function as well as identifying other cell types and conditions.

Uncaptioned visual

Figure 1. Visual descriptions of different groups and their specific parameters. The pink dot represents the origin of the cell, which is the geometric center of nucleus, the blue dots represent the geometric center of each 3D rendered object. Object-based group (OPG), nucleus-related group (NPG), and distance-related group (DPG) includes 16, 6 and 12 different parameters respectively. 


Uncaptioned visual

Figure 2. Machine learning classification comparison using cellular and subcellular morphological parameters in breast cancer cells.

A. Each cell line’s 3D rendered organelle object number. The purple line shows the mean of each organelle’s object number through 6 cell lines per cell, EEC mean = 215, EEC mean = 325, Mito mean = 76. 

B. Classification accuracy by Random Forest algorithm using different parameter groups at cellular level (The black bar shows the accuracy greater than 90%, the gray bar shows the accuracy smaller than 90%, same as Fig. 2C).

C. Classification accuracy by the Random Forest algorithm using different parameter groups at subcellular level in 3 organelle datasets including EEC, ERC and Mito. 


References

Zardavas, D., Irrthum, A., Swanton, C. & Piccart, M. Clinical management of breast cancer heterogeneity. Nature Reviews Clinical Oncology (2015) doi:10.1038/nrclinonc.2015.73.

Thul, P. J. et al. A subcellular map of the human proteome. Science (80-. ). (2017) doi:10.1126/science.aal3321.

Chang, A. Y. & Marshall, W. F. Organelles – understanding noise and heterogeneity in cell biology at an intermediate scale. J. Cell Sci. 130, 819–826 (2017).

Warren, A. et al. Global computational alignment of tumor and cell line transcriptional profiles. Nat. Commun. 12, 1–12 (2021).

Valm, A. M. et al. Applying systems-level spectral imaging and analysis to reveal the organelle interactome. Nature (2017) doi:10.1038/nature22369.

Collinet, C. et al. Systems survey of endocytosis by multiparametric image analysis. Nature 464, 243–249 (2010).

Zahedi, A. et al. Deep Analysis of Mitochondria and Cell Health Using Machine Learning. Sci. Rep. 8, 1–15 (2018).


17:10 - 17:13

78 Leveraging the Adaptive Particle Representation for efficient large-scale neurohistology

Jules Scholler1, Joel Jonsson2,3,4,5, Tomàs Jordà-Siquier6, Jorge Barros1, Laura Batti1, Bevan L. Cheeseman2,3,4, Stephane Pagès1, Christophe M. Lamy6, Ivo F. Sbalzarini2,3,4,5
1The Wyss Center for Bio and Neuroengineering, Geneva, Switzerland. 2Technische Universität Dresden, Faculty of Computer Science, 01069 Dresden, Germany. 3Max Planck Institute of Molecular Cell Biology and Genetics, 01307 Dresden, Germany. 4Center for Systems Biology Dresden, 01307 Dresden, Germany. 5Center for Scalable Data Analytics and Artificial Intelligence ScaDS.AI, Dresden/Leipzig, Germany. 6Division of Anatomy, Faculty of Medicine, University of Geneva, Geneva, Switzerland

Abstract Text

The abstract content is not included at the request of the author.

References

[1] B. L. Cheeseman, U. Günther, K. Gonciarz, M. Susik, and I. F. Sbalzarini, “Adaptive particle representation of fluorescence microscopy images,” Nature Communications, vol. 9, no. 1, Dec. 2018.

[2] A tool for fast automatic 3D-stitching of teravoxel-sized microscopy images (BMC Bioinformatics 2012, 13:316)

[3] S. Berg et al., “ilastik: interactive machine learning for (bio)image analysis,” Nature Methods, vol. 16, no. 12, pp. 1226–1232, Dec. 2019.

[4] Niedworok, C.J., Brown, A.P.Y., Jorge Cardoso, M., Osten, P., Ourselin, S., Modat, M. and Margrie, T.W., (2016). AMAP is a validated pipeline for registration and segmentation of high-resolution mouse brain data. Nature Communications. 7, 1–9.

[5] Tyson, A.L., Rousseau, C.V., and Margrie, T.W. (2021). brainreg: automated 3D brain registration with support for multiple species and atlases.


17:13 - 17:16

86 Exchangeable fluorophore labels in super-resolution fluorescence microscopy

Marius Glogger1, Christoph C. Spahn2, Marko Lampe3, Jörg Enderlein4, Mike Heilemann1
1Institute of Physical and Theoretical Chemistry, Goethe-University Frankfurt, 60438 Frankfurt, Germany. 2Max Planck Institute for Terrestrial Microbiology, 35043 Marburg, Germany. 3Advanced Light Microscopy Facility, European Molecular Biology Laboratory, Meyerhofstr. 1, 69117 Heidelberg, Germany. 4Third Institute of Physics - Biophysics, University of Göttingen, 37077 Göttingen, Germany

Abstract Text

We present fluorophore labels that transiently and repetitively bind to their targets as probes for various types of super-resolution fluorescence microscopy. Transient labels typically show a weak affinity to a target, and exchange constantly with the buffer that constitutes a reservoir with a large amount of intact probes, leading to repetitive binding events to the same target (we refer to these labels as “exchangeable labels”). This dynamic labeling approach is insensitive to common photobleaching and yields a constant fluorescence signal over time, which has been successfully exploited in SMLM [1-3], STED [4, 5], single-particle tracking [6] and super-resolution optical fluctuation imaging (SOFI) [7]. We discuss properties of suitable exchangeable labels, experimental parameters for optimal performance for the different super-resolution methods, and present high-quality multicolor super-resolution imaging.

References

1.            Jungmann, R., et al., Single-molecule kinetics and super-resolution microscopy by fluorescence imaging of transient binding on DNA origami. Nano Lett, 2010. 10(11): p. 4756-61.

2.            Sharonov, A. and R.M. Hochstrasser, Wide-field subdiffraction imaging by accumulated binding of diffusing probes. Proc Natl Acad Sci U S A, 2006. 103(50): p. 18911-6.

3.            Spahn, C.K., et al., A toolbox for multiplexed super-resolution imaging of the E. coli nucleoid and membrane using novel PAINT labels. Sci Rep, 2018. 8(1): p. 14768.

4.            Spahn, C., et al., Whole-Cell, 3D, and Multicolor STED Imaging with Exchangeable Fluorophores. Nano Lett, 2019. 19(1): p. 500-505.

5.            Spahn, C., et al., Protein-Specific, Multicolor and 3D STED Imaging in Cells with DNA-Labeled Antibodies. Angew Chem Int Ed Engl, 2019. 58(52): p. 18835-18838.

6.            Harwardt, M.I.E., et al., Single-Molecule Super-Resolution Microscopy Reveals Heteromeric Complexes of MET and EGFR upon Ligand Activation. Int J Mol Sci, 2020. 21(8).

7.            Dertinger, T., et al., Fast, background-free, 3D super-resolution optical fluctuation imaging (SOFI). Proc Natl Acad Sci U S A, 2009. 106(52): p. 22287-92.