Poster Session 1

17:15 - 18:15 Wednesday, 23rd June, 2021

Tracks Poster Session


46 3D protein localization in frozen cells for targeted lamella milling for electron cryotomography

Ernest van der Wee1, Daan Boltje1,2, Arjen Jakobi1, Jacob Hoogenboom1
1Delft University of Technology. 2Delmic B.V.

Abstract Text

Integrated cryogenic focused ion beam/scanning electron/fluorescence microscopy (cryo-FIB-SEM-FM) may be crucial to target proteins in frozen cells for lamella milling for electron cryotomography (cryo-ET). The integrated FM allows to select a region of interest for cutting lamella for cryo-ET. Inclusion of a fluorescently labeled protein precisely in this lamella may however require more advanced 3D localization. We have tested fluorescence super-resolution techniques for compatibility with the requirements for integrated cryo-FIB-SEM-FM. Using simulations, we have studied the effect of the cryogenic conditions and limited numerical aperture of the FM objective on the localization and targeting.

In-situ imaging of proteins in cells allows to characterize their native structure, conformation and their interactions with their environment. Cryo-ET enables this, but the proteins of interest need to be within a 100-200 nm thick lamella. Current targeting methods include fiducial markers with laborious transfer between different cryogenic microscopy setups, prone to contaminations on the sample. A simplified, integrated workflow will highly benefit the structural study of proteins in cells.

We use an epi-FM integrated into a cryo-FIB-SEM with a nitrogen micro-cooler, developed by Delmic together with us and an international consortium. In this microscope, the sample can be imaged with FM while the sample is in the position and orientation for FIB milling. Using this setup, we can select regions of interest (ROIs) in the sample to be included in the lamella. To assess targeting of sparse proteins, we have conducted simulations to test 3D localization techniques using point spread function (PSF) shaping techniques compatible with the experimental setup where the numerical aperture of the FM objective is limited by its long working distance.

We demonstrate we can cut lamella in a region selected in the FM images without transfer between different microscope setups, therefore preventing unnecessary contamination. For the 3D localization of sparsely labeled ROIs, we find that the fixed dipole orientation of the fluorophores cannot be ignored, even with the limited NA of the FM objective. We show how the localization precision depends on both the angle of the fluorophore with respect to the optical axis of the FM and the number of fluorophores per ROI. Finally, we discuss the different targeting scenarios relevant for the milling of lamella for cryo-ET.


51 Optical STEM: a novel detection technique for fast large-scale single- and multi-beam scanning electron microscopy

Arent Kievits1, Job Fermie2, Ryan Lane1, Jacob Hoogenboom1
1Delft University of Technology. 2Delmic B.V.

Abstract Text

We demonstrate here a benchmarking study for optical STEM, a new method for scanning electron microscopy. This method could potentially reduce acquisition times as well as outperform imaging with other existing detection modes in specific conditions.

Recent developments in electron microscopy have led to a significant scale-up in the imaging of biological tissues, making throughput a major bottleneck for further progress. Optimization of detection conditions can lead to an up to 20-fold increase in imaging speed for existing detectors (1). New techniques such as multibeam scanning electron microscopy (MB-SEM) (2, 3), where the sample is scanned in parallel by an array of beams, can even provide acquisition speeds that are orders of magnitude larger than for single-beam scanning electron microscopes. Optical scanning transmission electron microscopy (Optical STEM) is a novel detection method that can be applied in both single- and multi-beam electron microscopes and that holds profit to further increase acquisition speeds. We have carried out a detailed characterization, optimization, and benchmarking of Optical STEM detection to quantify its performance in relation to other electron detection techniques. This is particularly important as optical STEM is implemented as a detection method in MB-SEM, but it can also serve as an alternative for regular BSE detection or for a seamless imaging alternative to STEM.

In Optical STEM, ultrathin sections are directly mounted on a cerium-activated yttrium aluminum garnet (YAG:Ce) scintillator coated with a thin layer of molybdenum. This allows for efficient conversion of the transmitted electron signal to a photon signal (Figure 1) which is captured by a high NA objective and projected on a multipixel photon detector (Hamamatsu). We have conducted measurements on rat pancreas tissue stained with reduced osmium and zebrafish larva stained en bloc with reduced osmium followed by en bloc stain or post-stain with neodymium acetate, an alternative for uranyl acetate (4).

Our work builds on the results from Zuidema & Kruit, 2020 (5), where a model was created to predict the quality of optical STEM images with varying imaging conditions and sample preparation parameters. We have further analysed the performance of optical STEM detection on biological tissue in detail as a function of experimental parameters and benchmarked this against regular BSE detection and conventional STEM. Qualitatively, Optical STEM detection gives EM images with similar contrast and signal (Figure 2). Moreover, we compared quantitative image features such as the spectral signal-to-noise ratio and resolution between the different detection methods. Besides, we discuss the conditions in which optical STEM may outperform other techniques in terms of acquisition speed and show the application in fast large-scale imaging and multi-beam SEM.

In short, we have in detail characterized and optimized a novel detection method for scanning electron microscopy, optical STEM, as an alternative to conventional back scatter electron imaging of ultrathin biological tissue sections. Optical STEM was originally developed as a detection method in multibeam electron microscopy, but can potentially also reduce acquisition times in single beam scanning electron microscopy, outperforming BSE/STEM imaging in specific conditions. 

Uncaptioned visual

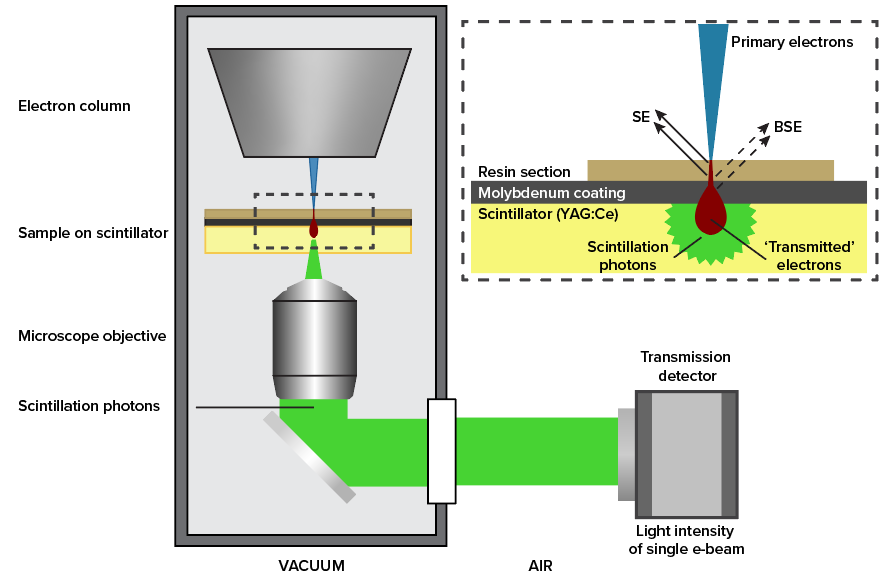
Figure 1: Schematic drawing of setup. The primary beam hits the sample which is on top of the scintillator.  The electron signal is converted to a photon signal. A high NA objective is used to capture a large fraction of the signal photons. The detector (a Hamamatsu multipixel photon counter) is located outside of the vacuum.

Uncaptioned visual

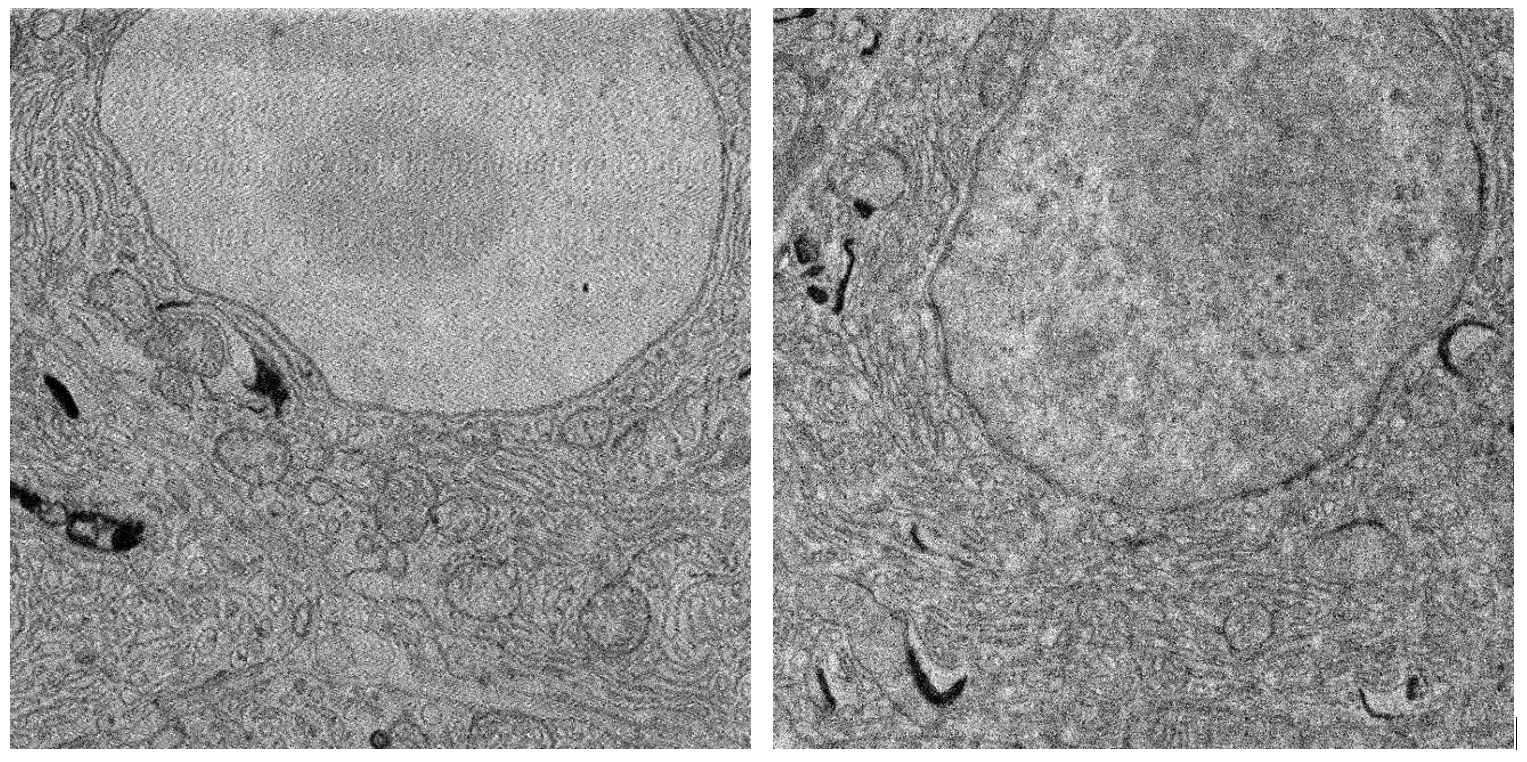
Figure 2: Comparison of backscatter and transmitted electron detection. (Left) Backscatter detector, 2kV landing energy, 400 pA beam current. (Right) Transmission detector, 5kV landing energy, 400 pA beam current. Sample: rat pancreas tissue (courtesy of Ben Giepmans group, UMC Groningen).


References

1.            R. Lane et al., Optimization of negative stage bias potential for faster imaging in large-scale electron microscopy. J Struct Biol X 5, 100046 (2021).

2.            A. Eberle et al., High‐resolution, high‐throughput imaging with a multibeam scanning electron microscope. Journal of microscopy 259, 114-120 (2015).

3.            Y. Ren, P. Kruit, Transmission electron imaging in the Delft multibeam scanning electron microscope 1. Journal of Vacuum Science & Technology B, Nanotechnology and Microelectronics: Materials, Processing, Measurement, and Phenomena 34, 06KF02 (2016).

4.            J. Kuipers, B. N. G. Giepmans, Neodymium as an alternative contrast for uranium in electron microscopy. Histochem Cell Biol 153, 271-277 (2020).

5.            W. Zuidema, P. Kruit, Transmission imaging on a scintillator in a scanning electron microscope. Ultramicroscopy 218, 113055 (2020).


52 Near infra-red branding (NIRB) in tissue: an efficient guide between different imaging modalities in 3D

Anna Kremer1,2,3, Evelien Van Hamme1,2,3, Peter Borghgraef1,2,3, Christopher Guerin1, Saskia Lippens1,2,3
1VIB BioImaging Core. 2Center for Inflammation Research, VIB. 3Department for Biomedical Molecular Biology, Ghent University

Abstract Text

Correlative Light and Electron Microscopy (CLEM) aims to image the exact same region in LM and EM with the goal to correlate ultrastructural detail to a fluorescent signal. With the development of volume-EM techniques like SBF-SEM and FIB-SEM, correlation in 3D has become more feasible. Volume electron microscopy allows for the automated acquisition of serial section imaging data that can be reconstructed in 3D to provide a detailed, comprehensive and accurate view of cellular ultrastructure. In addition, combining volume EM with super resolution techniques, decreases the resolution gap between LM and EM, making retracing of the ROI and eventual overlays more straightforward. Still, due to the difference in sample preparation between LM and EM, clear points of recognition (landmarks/fiducials) are needed to be able to retrace the region imaged by light microscopy in the electron microscope. Finally, after acquiring both LM and EM datasets, a second type of landmarks is needed to overlay both datasets correctly and make the final correlation.

Here, we present our strategy for 3D CLEM on tissue samples imaged by super resolution confocal microscopy in combination with SBFSEM and/or FIBSEM. In these workflows, we have made use of two types of landmarks: first, we need landmarks to find back the cell or region imaged in LM in the electron microscope and second landmarks or fiducials independent of the cell or structure of interest are needed to make overlay images of LM and EM data. Near infra-red branding with a 2-photon laser in specific geometric patterns was applied to guide us in the electron microscope to the ROI in mouse liver and Drosophila brain [1, 2, 4]. Detailed knowledge on the composition and measurements of the branded pattern allows to safely approach the region of interest in the electron microscope without the risk of removing parts of the sample that contain the ROI to be imaged. Depending of the structure of the tissue, patterns can be custom-designed to rule out possible confusion in the EM images between the landmarks and tissue-specific structures, like for example blood vessels. The figure below demonstrates how different patterns were used in mouse liver and Drosophila brain to unambiguously identify the ROI. For correctly overlaying LM and EM data extra fiducials are needed. These are largely tissue dependent as well as dependent on the precision needed for the overlay (cell vs organelle). For overlaying LM and EM 3D image stacks in mouse brain we used fluorescent labeling of the blood vessels. This is illustrated in purple in the top panel of the figure below.

In this study we demonstrate how NIRB can be applied and even required to follow the ROI during the elaborate steps going from LM over EM sample preparation to 3D EM image acquisition. This approach allowed us to make 3D-CLEM overlays and correlate the fluorescent signal to the ultrastructural detail provided by the electron microscope [2, 3, 4]. 

Uncaptioned visual

Figure: NIRB in tissue. Top panel: Pattern and measurements of landmarks applied in mouse liver to guide the electron beam to the ROI defined in LM, leading to a successful overlay of LM and EM data. Bottom panel: NIRB patterns in Drosophila brain mark the dendrite branching point of interest.


References

[1] Bishop, D., Niki´c, I., Brinkoetter, M. et al. (2011) Near-infrared branding efficiently correlates light and electron microscopy. Nat. Methods 8(7), 568–570.

[2] Bonnardel, J., T’jonck, W., Gaublomme, D. et al. (2019) Stellate Cells, Hepatocytes, and Endothelial Cells Imprint the Kupffer Cell Identity on Monocytes Colonizing the Liver Macrophage Niche. Immunity 51(4), 638–654 e9.

[3] Kremer, A., Van Hamme, E., Bonnardel, J. et al(2020). A workflow for 3D-CLEM investigating liver tissue. J. Microsc. doi: 10.1111/jmi.12967.

[4] Urwyler, O., Izadifar, A., Dascenco, D. et al. (2015) Investigating CNS synaptogenesis at single-synapse resolution by combining reverse genetics with correlative light and electron microscopy. Development 142(2), 394–405


61 STORM-TEM correlative imaging of replicative domains in optimally structurally preserved chromatin

Ekaterina Ryumina1,2, Sergei Golyshev1, Andrei Moiseenko3, Igor Kireev1,3
1Belozersky Institute of Physico-chemical Biology, Lomonosov Moscow State University, Moscow 119234, Russia. 2Faculty of Bioengineering and Bioinformatics, Lomonosov Moscow State University, Moscow 119234, Russia. 3Faculty of Biology, Lomonosov Moscow State University, Moscow 119234, Russia

Abstract Text

The principles of spatial organization of eukaryotic genome remain unclear. Current hypotheses, based primarily on microscopic observations, range from the idea of hierarchical folding to the "polymer melt" model. Great amount of data about chromatin structure was obtained using electron microscopy. Although it allows for high resolution, it has several disadvantages over light microscopy, long multistep sample preparation that casts doubts on structure nativity being one of them. 
Chromatin is a very heterogeneous structure and it is sensitive to the experimental conditions. This requires development of sample preparation approaches combining good structure preservation with efficient selective labeling of structural-functional chromatin states. In this study we used a modified method of replicative labeling (1) adapted for strong aldehyde fixation. It includes Edu-labeling of newly synthesized DNA, label detection with Click-chemistry and biotin-streptavidin and subsequent Nanogold-Ag amplification for TEM. This approach was applied for correlative superresolution and TEM microscopy by using a mixture of biotinylated and fluorescent (AlexaFluor-647) azides and sequentially imaging the samples by STORM microscopy and labeling the same replicative domains with streptavidin-Nanogold. 
This protocol has several advantages over previously published ones. Glutaraldehyde fixation ensures optimal preservation of chromatin near-native structure. Click-chemistry provides simple and extremely selective labeling of replicated DNA, without the need of DNA denaturation prerequisite for BrdU detection with antibodies used in previous reports. The use of streptavidin-Nanogold conjugates provides better penetration efficiency even into glutaraldehyde-fixed samples due to the relatively small size of the probe. Overall our protocol allows for high contrast high-efficiency pre-embedding labeling compatible with various 3D-electron microscopy techniques. 

The study was supported by RFBR grant 19-015-00273, RSF grant 17-15-01290.

References

1. Deng, X., Zhironkina, O. A., Cherepanynets, V. D., Strelkova, O. S., Kireev, I. I., & Belmont, A. S. (2016). Cytology of DNA replication reveals dynamic plasticity of large-scale chromatin fibers. Current Biology, 26(18), 2527-2534.


81 Laser-free super-resolution microscopy

Kirti Prakash
National Physical Laboratory, London, UK

Abstract Text

We report that high-density single-molecule super-resolution microscopy can be achieved with a conventional epifluorescence microscope setup and a Mercury arc lamp. The configuration termed laser-free super-resolution microscopy (LFSM), is an extension of single-molecule localisation microscopy (SMLM) techniques and allows single molecules to be switched on and off (a phenomenon termed as "blinking"), detected and localised. The use of a short burst of deep blue excitation (350-380 nm) can be further used to reactivate the blinking, once the blinking process has slowed or stopped. A resolution of 90 nm is achieved on test specimens (mouse and amphibian meiotic chromosomes). Finally, we demonstrate that STED and LFSM can be performed on the same biological sample using a simple commercial mounting medium. It is hoped that this type of correlative imaging will provide a basis for a further enhanced resolution.

Uncaptioned visual


References


Prakash, Kirti. "Laser-free super-resolution microscopy." bioRxiv (121061)

https://doi.org/10.1098/rsta.2020.0144


92 Correlative microscopy of samples of different topologies between light and electron microscopes

Joerg Wissler1, Martin Peschel2, Kathrin Rudolph1
1TESCAN GmbH, Zum Lonnenhohl 46, 44319 Dortmund, Germany. 2NIKON GmbH, Tiefenbroicher Weg 25, 40472 Düsseldorf, Germany

Abstract Text

A workflow for software-assisted correlative light and electron microscopy (CLEM) suitable for basic and sophisticated light microscopes is presented. Correlative microscopy is a permanent effort. The idea of correlative imaging and comparison sounds in the first moment easy but provides more challenges than often expected upon execution. Challenges include, for example, unexpected material contrasts, sample holder issues, lost, irretrievable region of interest positions to name only a few if correlative work between the different microscopic methods is performed. Often basic light microscopes do not provide any support for further correlated tasks although technically capable. CLEM additionally includes the challenge of different imaging preparation and environments. Light microscopy can be performed at normal atmospheric pressures. Electron microscopy (EM) needs vacuum conditions. In scanning electron microscopy (SEM), e.g., the sample cannot even be moved and viewed as easily as on most light microscopes. An additional limiting factor between the methods is often the limited field of view (FoV) of the light optics as well. The solutions for CLEM are often very specific for a certain task, complex engineered, and expensive due to the required precision. But for the most standard tasks in the lab, a simple correlation workflow would probably often suffice. Some SEMs provide the possibility of depicting large field of views of the samples. In those SEMs complete objects can be visualized in millimeter or centimeter scales and upon magnification also examined in detail up to the nanometer scale. The wide-field view is important and convenient for materials and life science samples. Orientation, the discovery of positions, and depictions of regions of interest are so enabled. On-stage cameras can help but not replace native large fields of view. The challenge is even more complex if topographic samples instead of flat samples are examined. The utilization of software image processing functions combined with a specific workflow enables to circumvent the limitations. Flat and topographical samples can be so examined in a similar manner. Tested on TESCAN and NIKON microscopes using for example the software packages CORAL and NIS, but not limited to, and basic equipment available, correlation of light and SEM sample images can be realized in lab real-time. 

References


34 UC2 BOX: A Modular Open-Source Toolbox for Optics Education

Barbora Marsikova1,2, René Lachmann1,2, Eda Bingöl1, Rainer Heintzmann1,3,2, Benedict Diederich1
1Leibniz Institute of Photonic Technology, Albert-Einstein-Str. 9, 07745 Jena, Germany. 2Faculty of Physics and Astronomy, Friedrich Schiller University, Jena, Germany. 3Institute of Physical Chemistry, Friedrich Schiller University, Jena, Germany

Abstract Text

UC2 (You.See.Too.) is a general purpose framework for building optical projects and bridging methods and technologies to provide tailored solutions. Building a microscope using UC2 becomes as easy as building a Lego© house, since the toolbox relies on commercially obtainable components and 3D-printed building blocks. It is available online [1] and fully open source, so that anyone can use it, reproduce it, and adapt it to their purposes. It is supported by detailed documentation and guidelines. Therefore, it provides an affordable and accessible tool for both education and research. 

We have developed a comprehensive educational kit, called TheBOX, to be used for teaching optics, microscopy, and potentially other fields of science. It comes in several versions to serve different levels of education. The FullBOX, equipped with a Raspberry Pi computer, can be used to build for example a brightfield transmission or a light sheet fluorescence microscope, as well as many other systems, and provide control over image acquisition via electronics. The CourseBOX is meant for demonstration and hands-on experience of the principles of Optics and Microscopy alignment, Abbe diffraction experiment and basics of some commonly used microscopy methods. The MiniBOX, simple and compact, covers the experiments from the ray optics chapters of secondary and high school education. 

We tested these BOXes in workshops at schools and universities and developed manuals for the experiments, to ease the job of the teachers and make it into an independent tool that can be used by anyone anywhere, as long as there is access to internet and a 3D printer. In the light of the pandemic situation, we also started testing the MiniBOX for the use in a flipped classroom concept. In that case, the course is held online while the participants borrow the BOX or build their own at home. This could be a welcomed option for universities and imaging facilities that are currently unable to offer practical courses and it could also support the development of international study programmes, which are taught online and attended by students worldwide. 

Figure 1: MinBOX unboxing

Uncaptioned visual

Figure 2: Flipped classroom workshop done in a collaboration with Witelo e.V. (wissenschaftlich-Technische Lernorte in Jena)

Uncaptioned visual

References

[1] UC2 GitHub repository [Online], 2019 [2021-04-12]   Available on: https://github.com/bionanoimaging/UC2-GIT 

[2] Diederich, B., Lachmann, R., Carlstedt, S. et al. A versatile and customizable low-cost 3D-printed open standard for microscopic imaging. Nat Commun 11, 5979 (2020). https://doi.org/10.1038/s41467-020-19447-9


2 Phasing Out Fluorescence: Quantifying Mitosis Label-free

Meetal Solanki1, Rebecca Charlton1, Karen Hogg2
1Phasefocus. 2University of York

Abstract Text

Mitosis is a crucial biological process that takes place in all eukaryotic cells and involves the equal segregation and division of a parent cell into two genetically identical daughter cells. This is distinguished by a highly regulated reorganization of cell components [1]. Changes to the cell cycle, e.g. in senescence, where there is irreversible arrest of cell proliferation, has been shown to lead to aging and age-related disease [2]. By contrast, uncontrollable cell division is a hallmark of cancer and is characterized by abnormal mitosis. Subsequently, several mitotic inhibitors have been used successfully as anti-cancer drugs [3].

The fungal toxin, cytochalasin D is used as a cytotoxic agent in cancer therapy as it disrupts actin polymerization and activates p53 independent pathways, causing arrest of the cell cycle at the G1-S phase transition. Nocodazole, another anti-cancer drug, works by impeding the formation of the mitotic spindle and cytokinesis. This arrests cells at a slightly different part of the cell cycle, blocking cells in mitosis [7]. Both these effects can result in inhibition of cellular processes such as cell division [4,5].

Current methods that exist to measure mitosis usually rely on the use of fluorescence markers, and relatively high light levels, which can ultimately perturb the natural function of cells [6]. Therefore, there is a need for a label-free technique that can reliably identify mitotic cells. Ptychography, a quantitative phase imaging (QPI) technique, produces high contrast images without the need for fluorescent labels. The consistent and enhanced contrast enables automatic segmentation and tracking of individual cells, as well as a quantitative measure of the single-cell phenotypic behaviour of whole populations. In this study we used a Livecyte system [8] to identify label free, unique phase signatures that indicate when a single cell is undergoing mitosis. A mitotic event is clearly distinguishable as the cell adopts a more spherical morphology with a greater optical thickness than resting cells.

The aim of this study was to measure and contrast the changes in mitosis between different concentrations of cytochalasin D and nocodazole as compared to untreated cells.  MBA-MB-231 cells Hela cells were seeded at 1600 cells per well and allowed to adhere for approximately 24 hours.  They were then preincubated with a range of concentrations of cytochalasin D and nocodazole before imaging.

Using Livecyte’s label-free QPI mode and in-built Analyse software, metrics derived from the Mitosis Dashboard were compared for the different conditions.  It revealed a dose dependent decrease in the number of mitotic events and thus proliferation in both cytochalasin D and nocodazole. It was also possible to distinguish where in the cell cycle these cells may have been arrested, notably through mitotic time values. Cytochalasin D treatment caused no difference in mitotic time indicating that cells underwent cell cycle arrest before mitosis. In contrast nocodazole increased the mitotic time in a dose dependent manner suggesting a block in the cell cycle at mitosis.

These observations were in line with those reported in the literature and reinforced the known mechanisms of both drugs giving more in depth information on the precise mechanism of action between these two cell cycle inhibitors.

Uncaptioned visual

References

1. Ferreira, L.T., Figueiredo, A.C., Orr, B., Lopes, D. and Maiato, H., 2018. Dissecting the role of the tubulin code in mitosis. Methods in cell biology, 144, pp.33-74.

2. Childs, B.G., Durik, M., Baker, D.J. and Van Deursen, J.M., 2015. Cellular senescence in aging and age-related disease: from mechanisms to therapy. Nature medicine, 21(12), pp.1424-1435.

3. H. Schatten, 2013. Mitosis. Brenner's Encyclopedia of Genetics (Second Edition), pp.448-451

4. Trendowski M., 2015. Using cytochalasins to improve current chemotherapeutics. Anticancer Agents Med Chem., 15(3). pp 327-33.

5. Rubtsova S.N. et al., 1998. Disruption of actin microfilaments by cytochalasin D leads to activation of p53. FEBS Lett., 430(3). pp 353-7.

6. Sivakumar, S., Daum, J.R. and Gorbsky, G.J., 2014. Live-cell fluorescence imaging for phenotypic analysis of mitosis. In Cell Cycle Control (pp. 549-562). Humana Press, New York, NY.

7. Kuhn, M., 1998. The microtubule depolymerizing drugs nocodazole and colchicine inhibit the uptake of Listeria monocytogenes by P388D1 macrophages. FEMS microbiology letters, 160(1), pp.87-90.

8. Livecyte Kinetic Cytometer, from Phasefocus, UK


3 Quantifying Macrophage Phagocytosis of Bioparticles

Meetal Solanki1, Rebecca Charlton1, Karen Hogg2
1Phasefocus. 2University of York

Abstract Text

Phagocytosis is the process by which a cell (e.g. macrophage, neutrophil or dendritic cell) engulfs pathogenic or foreign particles, giving rise to an internal compartment called the phagosome.  It is one of the main mechanisms of the innate immune system and a primary response to infection [1].

To understand the regulation of phagocytosis, and the impact that the cellular environment has on phagocytosis, particle engulfment must be quantified. Traditionally, this has been challenging but the use of fluorescent bioparticles combined with recent developments in real-time fluorescence microscopy has enabled measurement of total fluorescence intensity to quantify macrophage phagocytosis [2,3]. However, there are drawbacks with live fluorescence microscopy; for instance, phototoxicity is frequently encountered which can impair sample physiology, and even lead to cell death [4]. Furthermore, fluorescence microscopy analysis typically quantifies total fluorescence intensity which can be misleading and inhibits the study of population heterogeneity.

The aim of this study was to quantify phagocytosis of bioparticles by a RAW 264.7 macrophage-like cell line in a manner that both reduced phototoxic effects and reliably quantified cell fluorescence. In addition, as phagocytosis involves the actin-driven internalization of particles, we sought to monitor the dose-response of the actin inhibitor cytochalasin D on phagocyte behavior.

RAW 264.7 cells were seeded at 10,000 cells per well and allowed to adhere for approximately 24 hours. Cells were then incubated with pHrodo green E. coli bioparticles, which only fluoresce in the acidic environment of the phagosome and concentrations of cytochalasin D (10µM - 1nM). Label-free quantitative phase imaging, with a Livecyte Kinetic Cytometer [5], was used with intermittent fluorescence to automatically track cells over time and measure fluorescence periodically; this enabled investigation of phagocytosis whilst substantially reducing phototoxicity effects. The high contrast label-free images produced by Livecyte facilitated robust segmentation of cells and therefore phagocytosis activity could be quantified reliably by measuring individual cell fluorescence.

Through analysis of outputs generated by Livecyte’s Fluorescence Dashboard, a dose-dependent reduction in the median fluorescence intensity of the cells, therefore reduction in cell phagocytosis, with cytochalasin D treatment was determined. In addition, by analysing the cell fluorescence intensity and cell count, it was observed that the phagocytes were at their most active after 8 hours. 

This data suggests cytochalasin adversely affects phagocytosis of bioparticles possibly though inhibiting the actin machinery needed by macrophages to internalize foreign particles. It also utilizes single-cell segmentation algorithms and time-lapse imaging to give a reliable reading into fluorescence intensity and further insight into differences between phagoctyic activity throughout the experiment without causing phototoxicity.

Uncaptioned visual

References

1. Uribe-Querol & Rosales, 2017. Control of Phagocytosis by Microbial Pathogens. Front Immunol. 8. 1368.

2. Kapellos, Taylor, Lee, Cowley, James, Iqbal and Greaves, 2016. A novel real time Imaging platform to quantify macophage phagocytosis. Biochem. Pharmacol. 116. 107-119.

3. Life Technologies, 2013. pHrodoTM Red and Green BioParticles® Conjugates for Phagocytosis. 1-6.

4. Icha, Weber, Waters and Norden, 2017. Phototoxicity in live fluorescence microscopy, and how to avoid it. Bioessays. 39(8).

5. Livecyte available from Phasefocus, UK.


10 Imaging dynamics of Plasmodium CSP

Carolina Thieleke-Matos1, Mirko Singer2, Kevin Walz1, Sylvia Munter1,3, Freddy Frischknecht1
1Integrative Parasitology, Center for Infectious Diseases, Heidelberg University Medical School, Im Neuenheimer Feld 344, 69120 Heidelberg, Germany. 2Experimental Parasitology, Department for Veterinary Sciences, Ludwig-Maximilians-University Munich, Munich, Germany. 3Infectious Diseases Imaging Platform, Center for Infectious Diseases, Heidelberg University Medical School, Im Neuenheimer Feld 344, 69120 Heidelberg, Germany

Abstract Text

CSP is the most abundant protein on the surface of Plasmodium sporozoites and the target of the most advanced, yet not highly efficient, subunit malaria vaccine, RTS,S. CSP is essential for sporozoite formation, entry into both mosquito salivary glands and mammalian livers and contains several domains including a central repeat. Antibodies against this repeat can stop sporozoite migration in the skin and liver cell entry. During migration CSP is shed into membraneous trails that are left on the substrate. To understand the dynamics of CSP during sporozoite formation (1) and migration we generated several transgenic Plasmodium berghei parasite lines expressing the circumsporozoite protein fused internally to a green fluorescent protein. This allowed visualization of CSP during sporozoite development and motility using orbital-TIRF microscopy and may provide a new assay system to characterize anti-CSP antibodies.


References

(1) Singer M and Frischknecht F (2021) Fluorescent tagging of Plasmodium circumsporozoite protein allows imaging of sporozoite formation but blocks egress from oocysts. Cellular Microbiology, 23: e13321.


20 Optimizing a three-photon microscope by direct monitoring of group delay dispersion at the sample plane.

Sanjeev Kaushalya, Hans Fried
CRFS, Light Microscope Facility, Deutsches Zentrum für Neurodegenerative Erkrankungen e. V. (DZNE) - Bonn

Abstract Text

In multiphoton microscopy, laser pulse width measurements at the setup plays an important role in optimizing the fluorescence output with least laser power applications. For example, in deep two- and three-photon intravital microscopy it is very crucial to have shortest possible laser pulses for efficient excitation with lowest possible laser power at the sample. Laser pulses used in multi-photon microscopy have a large spectral bandwidth and therefore dispersion broadens the pulse width significantly. A broadened pulse at the sample results in much lower fluorescence and usage of higher laser power to increase the fluorescence signal can quickly result in photo damage. Here, we used a self-built and portable optical collinear autocorrelator, to probe the beam anywhere in the beam path and after the objective to measure the pulse width, and to optimize with a pre-chirp (dispersion compensation) unit. We demonstrate that fluorescence excitation efficiency could be increased by many fold in three-photon microscopy.


25 Introducing ivMic: Workgroup Intravital Microscopy of the the German BioImaging - Society for Microscopy and Image Analysis (GerBI-GMB)

Katrin Roth1, Hans-Ulrich Fried2, Michael Gerlach3, Christian Kukat4, Silke Tulok3
1Philipps University Marburg. 2DZNE Bonn. 3TU Dresden. 4MPI AGE, cologne

Abstract Text

Microscopy on live animals (intravital microscopy) is a small but steadily growing field. Because of the diverse and fast-moving array of special techniques and specific problems in intravital microscopy, the workgroup Intravital Microscopy (ivMic) was founded within German BioImaging - Society for Microscopy and Image Analysis (GerBI-GMB). IvMic aims to be an active network fostering dynamic exchange of information and techniques specific to intravital microscopy. The main goals of ivMic are to link professionals and specialists as well as to create a platform which provides an overview of methods and technologies. Since 2018, ivMic members have organized an annual conference (“Day of Mouse Intravital Microscopy”). It features lectures and round table discussions on microscopy, research, special technical approaches, and compliance with animal wellbeing regulations in the field of intravital microscopy. Furthermore, ivMic establishes databases on methods and technologies which are explained in this poster and can be accessed in detail via the GerBI-GMB home page (https://gerbi-gmb.de/). 


31 Deconvolution live-cell microscopy reveals the role of CDK1 kinase in regulating human chromosome-microtubule attachments

Xinhong Song, Viji Draviam
School of Biological and Chemical Sciences, Queen Mary University of London, London (UK)

Abstract Text

Bi-oriented attached chromosomes separate equally under the pulling force from opposing poles of the spindle; non-bioriented attachments are removed by Aurora-B mediated error correction pathway. But this opens a puzzle: before the formation of bi-oriented attachment, mono-oriented attachments should be protected from being destabilised by the error correction mechanism. However, how mature mono-oriented end-on attachment is recognised and preserved remains unclear. Tracking the dynamic localisation of the microtubule-associated protein, Astrin, with time-lapse deconvolution microscopy allows us to study the kinetochore composition and function. Quantitative analysis shows a distinct increase in the Astrin level on the mono-oriented end-on attached kinetochore following the inhibition of CDK1, a master mitotic kinase, independent of the error correction pathway mediated by Aurora-B. This suggests that CDK1 plays an important role in regulating outer kinetochore composition and mono-oriented attachment stability. What is more, unlike CDK1, the mitotic checkpoint complex member Mps1 does not regulate Astrin level at the end-on attached kinetochore. Here, we will present high-resolution 3D movie stills to show how the mitotic kinase CDK1, but not MPS1, negatively regulate Astrin recruitment at the kinetochore. The work provides insight into how cells protect the mature end-on kinetochore-microtubule attachment to ensure accurate chromosome segregation.


69 Imaging an embryonic heartbeat: light sheet microscopy of fast zebrafish cardiac dynamics

Anjalie Schlaeppi1,2, Alyssa Graves1, Michael Weber1, Rory Power3, Nicola Gritti4, Michaela Mickoleit2, Kyle Harrington55,6, Jan Huisken1,7
1Morgridge Institute for Research. 2Max Planck Institute of Molecular Cell Biology and Genetics. 3EMBL Imaging Center Heidelberg. 4EMBL Barcelona. 5Max Delbrück Center for Molecular Medicine. 6University of Idaho. 7University of Wisconsin

Abstract Text

To understand key developmental processes, observing them in healthy, living samples is critical. With its low photo-toxicity, deep optical penetration, speed and sensitivity, light sheet fluorescent microscopy (LSFM) is becoming the tool of choice to image a wide range of biological processes, from early development and organogenesis to regeneration. Embryonic cardiac research specifically has greatly benefited from advances in live, fast LSFM. Combined with the rapid external development, tractable genetics and translucency of the zebrafish Danio rerio, LSFM can deliver insights into cardiac form and function at high spatial and temporal resolution without significant photodamage. However, LSFM of beating hearts is challenging as it requires maintaining a healthy sample in a constricted field of view and acquiring ultrafast images to resolve the heartbeat. 

Here we describe optimized tools and solutions to study the zebrafish heart in vivo. We recommend bright transgenic lines labeling cardiac elements, new gentle embedding solutions, and report progress in immobilization techniques that avoid developmental defects and do not affect heart rate. We also propose a data acquisition and analysis pipeline adapted to cardiac imaging. With this workflow, we show that when the myocardium contracts, it applies pressure on the incompressible but mobile cardiac jelly, thus propagating forces to the endocardium. We reveal how the endocardium then prevents backward flow and allows efficient pumping. This study illustrates how a custom-built light sheet microscope and dedicated analysis tools reveal previously unseen details in the fragile, rapidly moving heart. The workflow presented here focuses on zebrafish embryonic heart imaging but can also be applied to various other samples and experiments.


70 Dynamics of chromatin proteins RSF1, CENPS and CENPX at laser induced DNA double strand breaks

Pritishkumar Tidke1,2, Andrew Flaus2, Helen Dodson1
1Department of Anatomy, National university of Ireland, Galway, Ireland. 2Centre for Chromosome biology, Biomedical Sciences Building, National university of Ireland, Galway, Ireland

Abstract Text

Chromatin has a major influence on the DNA damage response (DDR). Several chromatin-related factors contribute to specialized DNA packaging during the DDR including the CENPS and CENPX histone fold proteins (also known as MHF1/2) and the chromatin remodelling factor RSF1. We hypothesised that CENPS/X could contribute to an intermediate and more accessible state of chromatin packaging that facilitates the resection and repair process. To establish the dynamic exchanges of these chromatin components during the DDR we have defined a timeline for recruitment and removal of MRE11, RSF1, CENPS, and CENPX at induced DNA double strand breaks (DSBs). 

Stable expression of GFP-tagged CENPS, CENPX and RSF1 was established in HeLa Kyoto (HK) cell lines by transfection and selection in order to observe the DDR in real time by laser microirradiation followed by live confocal imaging. We explored mild conditions to induce DSBs in HK cells using a chemical sensitiser and 405 nm laser microirradiation and found that 2 µM Hoechst-33342 treatment followed by 0.5 mW laser power created single foci of recruitment at the sites of microirradiation while other combinations had insufficient fluorescence intensity or resulted in excessive damage with non-specific foci outside the region of interest. The induction of DSBs at sites of microirradiation was validated by co-localisation of gH2AX immunostaining (Figure 1A). 

Fitting a consecutive chain reaction model to the observed time course of fluorescence at microirradiated foci then enabled quantitative estimation of the half time of recruitment (K1HT) and removal (K2HT) for GFP-tagged MRE11, RSF1, CENPS and CENPX using at least 20 measurements from five biological replicates. MRE11 recruitment and removal (K1HT 38 ± 6 sec; K2HT 1370 ± 470 s) is consistent with reported values for the MRN complex and precedes RSF1, CENPS and CENPX (K1HT 89 ± 16, 93 ± 16, 103 ± 16 s; K2HT 1940 ± 500, 2360 ± 510 and 2100 ± 440 s respectively) (Figure 1B-D). The three chromatin components are recruited and removed at a similar time to each other within the resolution of the measurements. This locates the chromatin-related components at DSBs at a time subsequent to non-homologous end joining (NHEJ) components observed by others using the same method, and with recruitment and removal times that immediately precede the homologous recombination (HR) machinery.

A caveat to these measurements is that the cell cycle phase is unknown and likely to be dominated by G1 cells. To study the cell cycle phase specific association of CENPS and CENPX at DSBs, we prepared dual tagged HK cell lines stably expressing RFP-PCNA and either GFP-CENPS or GFP-CENPX. These cells were synchronised by double thymidine block and microirradiated at optimal times for enrichment in S, G2 or G1 phases. We observed that CENPS and CENPX are recruited to DSBs in all phases of the cell cycle, but that the half time of their recruitment and removal in G2 phase (K1HT 137 ± 24 and 144 ± 15s; K2HT  3710 ± 870 and 2600 ± 390 s respectively) is somewhat delayed compared to G1 and S phase (K1HT 106 ± 23 and 108 ± 23 s; K2HT 1650 ± 290 and 1690 ± 190 s respectively) (Figure 1 E).

We also estimated the abundance of CENPS and CENPX recruited to the focus by normalising to the total available fluorescent signal in each cell before microirradiation. This revealed that G2 recruitment is three times higher than in G1, which explains the apparent delay in G2 since the time to achieve half maximal abundance would be longer at constant recruitment and removal rates.  

Previous work has shown that CENPS and CENPX bind simultaneously to two DNA duplexes as CENPS/X heterotetramers, and that they are recruited to DSBs by the chromatin remodelling factor RSF1 for efficient DSB repair, possibly linked to the association of CENPS/X with FANCM. Our observations demonstrate that CENPS/X recruitment occurs between the regimes of fast NHEJ and slower HR, at a time consistent with published estimates for ATM activation that initiates resection. The release of CENPS/X is at a similar time to the recruitment of RAD51. This place the histone fold containing DNA binding CENPS/X in the vicinity of DSBs at the time when their nucleosomes are being actively remodelled to enable resection, and increased abundance of CENPS/X at DSBs in G2 correlates with extended resection for HR. Our work provides an in vivo basis for investigating the detailed mechanistic and structural contribution of CENPS/X in the DDR.


Uncaptioned visual


Figure 1. Live cell quantitative microscopy of chromatin components at DSBs. A. HeLa Kyoto (HK) cells expressing GFP-fused proteins were fixed and stained with anti-gH2AX 600 s after stripe microirradiation (yellow arrowhead). Scale bar 10 μm. B. HK cells were imaged for up to 1800 seconds after spot microirradiation (yellow circle at 0 s). Scale bar 10 μm. C. Normalised fluorescence intensity at 2 s intervals at a defined ROI surrounding the microirradiation site for MRE11-GFP, RFP1-PCNA, GFP-RSF1, GFP-CENPS and GFP-CENPX averaged over 21 cells from at least 5 biological replicates. D. Half time of recruitment and removal. Error bars indicate 95% confidence interval. E. Half time of recruitment and removal of GFP-CENPS and GFP-CENPX at the microirradiation site in G1, S and G2 phases. Error bars indicate 95% confidence interval. Groups were compared by a two tailed Student’s t-test with p values indicated as * ≤0.05, ** ≤0.01, *** ≤0.001, **** ≤ 0.0001, ns = not significant.

References


74 A Fast Projection Imaging Method for the Quantification of the Dynamics of Endosome Maturation

Xian Hu1, Salma Jalah2, Michael Sheetz3, Oddmund Bakke4, Felix Margadant5
1Center for Molecular Medicine Norway, University of Oslo, Norway. 2University College London, UK. 3Department of Biochemistry & Molecular Biology, UTMB, US. 4Department of Biosciences, University of Oslo, Norway. 5Center of Cancel Reprogramming, Radium Hospital, Norway

Abstract Text

Despite progress made in confocal microscopy, even fast systems still have insufficient temporal resolution for detailed live-cell volume imaging, such as tracking rapid movement of membrane vesicles in three-dimensional space. By sacrificing detailed information in the Z-direction, we propose a new imaging modality that involves capturing fast ‘projections’ from the field of depth and shortens imaging time by approximately an order of magnitude as compared to standard volumetric confocal imaging. The implementation minimally requires two synchronized control signals that drive a piezo stage and trigger the camera exposure. The device generating the signals has been tested on spinning disk confocal and instant structured-illumination-microscopy (iSIM) microscopes. Since the initial publication of the method, we have made several improvements on system stablization and stepping speed, and have implemented the system onto two other imaging platforms other than our own microscope.

References

  Hu, X., Jalal, S., Sheetz, M., Bakke, O., Margadant, F., 2020. Micro-stepping Extended Focus reduces photobleaching and preserves structured illumination super-resolution features. J. Cell. Sci. https://doi.org/10.1242/jcs.240796   

82 Mechanical Forces during Lymph Node Expansion Govern Fibroblastic Reticular Network Remodeling

Harry Horsnell1, Robert Tetley2, Henry Belly3, Spyridon Makris1, Agnesska Benjamin1, Ewa Paluch3, Yanlan Mao2, Sophie Acton1
1Stromal Immunology Group, MRC-LMCB at UCL. 2Tissue Mechanics Group, MRC-LMCB at UCL. 3University of Cambridge

Abstract Text

The abstract content is not included at the request of the author.


43 Real-Time Monitoring of Wound Healing by Using Label-free Multiphoton Microscopy and the 3D Printed Live-cell Imaging Chamber

Haijiang Zhang, Che-Wei Chang, Rafael Camacho, Julia Fernandez-Rodriguez
Centre of Cellular Imaging, Core Facilities, the Sahlgrenska Academy, University of Gothenburg, Sweden

Abstract Text

Abstract:

Current skin research typically relies on classical histopathological examination, either by studying the abnormality of the surface or vertical sections across the tissue. The drawbacks of this type of end-point experiment for studying wound healing are its destructive nature and that the outcome can only be rationalized retrospectively. To reliably observe the skin biology directly, the optimal experiment would require monitoring live tissue in real-time with an imaging system capable of recording cellular responses a few hundred mm under the skin surface. One-photon microscopy, although capable of achieving sub-micron resolution, generally can only image the surface of the skin tissue, due to the nature of the one-photon absorption/emission, and more importantly, the imaging limitations caused by the tightly packed keratinocyte cells. This study demonstrates that multiphoton laser scanning microscopy is a good imaging technique for monitoring wound healing in ex vivo skin models while using a 3D printed microfluidics chamber for keeping the tissue viable. Multiphoton microscopy is capable of deep tissue imaging down to ~300 μm and is able to monitor the cellular proliferation and collagen regeneration without adding external fluorescent markers, which could potentially interfere with native cellular functions. Further, the 3D printed microfluidics chamber we designed can be integrated into commercial microscopy incubation systems to create an artificial growth mini-environment for keeping tissue alive for prolonged periods of time. In this study, real-time monitoring of wound healing was achieved at the depth of ~300 μm during 3-7 days. 

Summary:

Skin is the largest human organ and acts as the primary defense barrier to the outside environment. However, it is far from being simply an inert shield; rather, it is a highly complex and well-structured integumentary system upholding homeostasis and immunologic defense responses. Any damage to the skin will possibly affect the whole organism if the healing process does not progress in a timely manner. Aside from the regular mechanical injury to the skin in daily life, fundamental questions surrounding wound healing, and how age or diseases such as diabetes affect wound healings need to be addressed with more advanced monitoring protocols. The focus on creating better treatments and medicine for repairing wounds more efficiently has accelerated in the past decade thanks to advancements in cellular imaging tools, in which the sub-micron resolution can now be easily achieved in most commercial light microscopes. Nevertheless, the real-time monitoring for wound healing has been challenging due to the reasons below: 

(1) Real-time monitoring is not easily achieved. In histopathological imaging techniques, the tissue needs to be fixed, sectioned, and then stained before visualization. This means that important morphological information might be lost in this destructive sample preparatory phase. Furthermore, in order to fully understand how cell motility and multiplication occur, it is necessary to monitor regenerative processes over time.

(2) Conventional one-photon imaging tools are not adequate for two main reasons: (A) Conventional light microscopy typically relies on external fluorescent labels to visualize specific cellular components. The main drawback is that these labels could potentially interfere with the wound healing process and mislead the conclusions. (B) Typically, one-photon microscopes can only image up to ~ 30 μm under the skin surface. Moreover, skin is mainly composed of an outermost epidermis that is tightly packed with several layers of keratinocytes, melanocytes, Langerhans cells, and immediately under that a deeper dermis that contains tough connective tissue, hair follicles, and sweat glands. Since the thickness of the epidermis is already at the range of ~ 100 μm, one-photon microscopy is not able to record how re-epithelization in deep dermis layers occurs.    

(3) Keeping skin tissue viable is challenging. While some ex vivo methods have been developed to understand how cell motility and proliferation occur, the main challenge is still to keep the tissue alive and fully functional over a long period of time. 

 This study overcomes all three main challenges by utilizing multiphoton microscopy for deep tissue imaging and a 3D-printed microfluidics chamber. Multiphoton microscopy proved two major advantages: label-free and deep-tissue imaging. Since light with a longer wavelength is able to penetrate deeper into the tissue, multiphoton microscopy uses a pulsed laser at the range of 800-1100 nm as the excitation source. In skin tissue, live cells and connecting tissue such as collagen and elastin generate autofluorescence. More importantly, collagen is also a strong second harmonic generation (SHG) emitter and therefore makes it possible to record how cells regenerate skin tissues in real-time without adding any exogenous fluorescence labels.   In order to observe wound healing, a wound with a 3 mm diameter and close to 400 mm depth was created on the 1 cm x 1 cm x ~ 0.8 cm skin tissue sample. The tissue was then placed in the live cell imaging microfluidics chamber and then imaged by an upright multiphoton microscope. Several Regions-of-Interest (450 x 450 μm2  with a 350 μm Z-stack) were recorded close to the wound and imaged every hour over the periods of 3-7 days. The time series of each Z-stack was then segmented into different cellular components by using machine learning algorithms. With this protocol, we are able to distinguish between epidermal keratinocytes, living keratinocytes, collagen, and elastin.   


63 Live imaging for high-throughput screening using a mobile device and Magnetic 3D Bioprinting.

Glauco Souza
Greiner Bio-One

Abstract Text

The abstract content is not included at the request of the author.

References

Souza GR, Molina JR, Raphael RM, Ozawa MG, Stark DJ, Levin CS, Bronk LF, Ananta JS, Mandelin J, Georgescu M-M, Bankson JA, Gelovani JG, Killian TC, Arap W, and Pasqualini R. Nature Nanotechnol 5: 291-296, 2010.

Timm DM, Chen J, Sing D, Gage JA, Haisler WL, Neeley SK, Raphael RM, Dehghani M, Rosenblatt KP, Killian TC, Tseng H, Souza GR. Sci Rep, 3:3000, 2013.

Haisler WL, Timm DM, Gage JA, Tseng H, Killian TC, Souza GR. Nat Protoc, 8: 1940-9, 2013. 

Tseng H, Gage JA, Shen T, Haisler WL, Neeley SK, Shiao S, Chen J, Desai PK, Liao A, Hebel C, Raphael RM, Becker JL, Souza GR.  Sci Rep, 5:13987, 2015.

Adinea C, Nga K, Rungarunlertb S, Souza GR, and Ferreira J.  Oct;180:52-66. Biomaterials, 2018.

Ferreira J, Hasan R, Urkasemsin G, Ng K, Adine C, Muthumariappan S, and Souza GR. J Tissue Eng Regen Med, 01/21, 2019.


83 “Dry-immersion” LSFM chambers for serial imaging of organoids and spheroids

Francesco Pampaloni1, Julien Colombelli2
1Goethe University Frankfurt - BMLS, Frankfurt am Main, Germany. 2Institute for Research in Biomedicine (IRB), Barcelona, Spain

Abstract Text

Light sheet fluorescence microscopy (LSFM) is the technology of choice for imaging large organs and three-dimensional cell cultures. However, the geometry of conventional LSFM set-ups does not allow operations that are common in microscopy, such as exchanging the objective lens, or quickly remove a substrate plate and serially replacing it with other ones. Although Oblique Plane Microscopy (OPM) solves many of these issues by integrating light sheet illumination in an inverted microscope, it requires a very precise alignment to not compromise the overall NA. Moreover, OPM does not allow for straightforward multiangle imaging, which is quite important for the analysis of large specimens in toto. Thus, a new generation of LSFM chambers allowing for serial imaging of multiple specimens is a highly desirable advancement for biologists. We present LSFM chambers that implement a novel technology for “dry immersion” of water-dipping objective lenses. Due to the “dry-immersion” approach, the chambers are easily detached from the set-up without removing neither the immersion water nor the specimen inside. In one of the possible experimental setups, the chamber with its specimen can be placed back in the incubator and replaced in the microscope with another one. This allows serial imaging of different specimens during the same experiment. In addition to the “dry-immersion” technology, the construction of the chambers itself exploits several innovative approaches: fully 3D printed as a block, “minimally assembled” (meaning that no screws, O-ring, or other parts are used to assemble and seal the chamber), “panoramic” observation window. We demonstrate the application of the new chambers for the screening of organoids and spheroids.


35 Amphiphilic markers for bio-imaging: gold nanoclusters and amyloids under TEM and fluorescence examination.

Patryk Obstarczyk, Anna Pniakowska, Marcin Grzelczak, Joanna Olesiak-Banska
Advanced Materials Engineering and Modelling Group, Wroclaw University of Science and Technology, Wybrzeże Wyspiańskiego 27, 50-370 Wroclaw, Poland

Abstract Text

Uncaptioned visual

Graphical abstract: Cartoon of crown-ether capped gold nanoclusters phase transfer due to the cation complexation


Noble metal nanoclusters (NCs), being a contractual bridge between single metal atoms and broadly studied bulk materials, exhibit extraordinary optical properties, significantly influenced by the type of metallic core atoms or protecting ligands [1]. Their molecule-like behavior, potential functionality and small size alongside the versatile control over their chemical formation are attracting an ever-growing attention in terms of modern bio-imaging. Herein, we present novel luminescent material, crown-ether capped gold nanoclusters, whose feature is the amphiphilicity governed by complexation of ligands. The main purpose of designing small nanoclusters stabilized with supramolecular ligands is to take advantage of host-guest functionality for efficient modulation of gold nanostructures hydrophobicity to sufficiently and selectively stain various biological systems. We applied these nanoclusters for amyloid formation studies. We present the concept of cation complexation by gold NCs capped with thiolate crown ether, leading to gradual change of clusters hydrophilicity to hydrophobicity, which determinate the interactions with protein aggregates [2,3,4]. Amyloid fibrils are associated with neurodegenerative diseases (e.g. Alzheimer’s disease) and characterized by unique structure with distinctive cross-β-sheet conformation, where hydrophobic and hydrophilic parts of amyloidogenic protein are distinctly folded [5]. As expected, our NCs were binding to amyloid fibrils, which was observed under TEM imaging. Moreover, crown-ether capped NCs present luminescence with distinct band located in near infra-red wavelengths. Our NCs can be applied as functional cation-sensitive markers for one- and two-photon microscopy. Therefore, we present a new type of amphiphilic nanomaterials which tailored spectral properties for various applications in bio-imaging of hydrophobic and hydrophilic interfaces.

References

[1] Olesiak-Bańska, J.; Waszkielewicz, M.; Obstarczyk, P.; Samoć, M. Two-Photon Absorption and Photoluminescence of Colloidal Gold Nanoparticles and Nanoclusters, Chem. Soc. Rev., 2019,48, 4087-4117

[2] Grzelczak, M. P.; Hill, A. P.; Belic, D.; Bradley, D. F.; Kunstmann-Olsen, C.; Brust, M. Design of Artificial Membrane Transporters from Gold Nanoparticles with Controllable Hydrophobicity. Faraday Discuss. 2016, 191, 495–510

[3] Wasada, H.; Tsutsui, Y.; Yamabe, S. Ab Initio Study of Proton Affinities of Three Crown Ethers. Journal of Physical Chemistry 1996, 100, 7367–7371

[4] Tian Y, Zhang X, Li Y, Shoup TM, Teng X, Elmaleh DR, Moore A, Ran C. Crown ethers attenuate aggregation of amyloid beta of Alzheimer's disease. Chem. Commun., 2014,50, 15792-15795

[5] Iadanza, M.G., Jackson, M.P., Hewitt, E.W. et al. A new era for understanding amyloid structures and disease. Nat Rev Mol Cell Biol, 2018, 19, 755–773


45 High-throughput imaging of cells and viruses at single particle resolution using Xfold slides

NAGARAJAN SUBRAMANIYAM
Xfold Imaging Oy

Abstract Text

The abstract content is not included at the request of the author.


References


57 An excellent one-photon and multiphoton bioimaging potential enclosed in ultra-small chiral gold nanoclusters

Anna Pniakowska, Magdalena Waszkielewicz, Joanna Olesiak-Bańska
Advanced Materials Engineering and Modelling Group, Wroclaw University of Science and Technology, Wroclaw, Poland

Abstract Text

Gold nanoclusters (GNCs) are classified as a new class of nanomaterials with overall particle dimensions below 2 nm. Their photophysical and optical properties, tailored by their atomically precise structure attract remarkable attention. Rigorous control of synthesis procedure and efficient functionalization enables to achieve uniform and, if needed, highly fluorescent nano-materials. Unique optical properties arising from molecule-like behaviour and discrete electronic structure of atomically defined GNCs have already been widely studied in the linear regime. Nevertheless, prominent nonlinear optical properties highlight the significance of GNCs as fluorescent markers in multiphoton microscopy. [1,2]

Two-photon fluorescence microscopy (2PFM) is found as an alternative to a conventional confocal microscopy, providing better penetration depth and lower phototoxicity. Moreover, the near-infrared wavelengths used in this technique are known as optical window for bio-materials. Gold nanoclusters meet the demands of bioimaging probes as a perfect combination of small size structure, good photostability as well as high two-photon absorption (2PA cross sections over 7000 GM) and efficient photoluminescence in near-infrared region. Their structural and functional properties can be also customized by wide range of ligands, which may be utilized in bio-conjugation with high selectivity. In addition, long fluorescence lifetime of nanocluster probes opens usability of nanoclusters for FLIM microscopy.


In this work we describe the synthesis, purification and characterisation of optical properties of gold nanoclusters. Great potential of nanoclusters was broadly studied under one-photon (1P) and two-photon (2P) excitation, revealing enhanced luminescence induced by nanoclusters aggregation or metallic core doping. We report spontaneous and polymer-induced aggregation, resulting in six times stronger photoluminescence of polymer-stabilized aggregates in comparison to gold-silver NCs itself, and an order of magnitude higher photoluminescence in respect to GNCs. [3]

Finally, we present particular case of fluorescent gold nanoclusters being stabilized with rigid, chiral ligands to induce over 75% quantum yield and strong chirality. Enhanced luminescence enables to obtain high two-photon absorption cross-section and one- and two-photon fluorescence detected circular dichroism (FDCD) parameters. Then, presented nanoclusters may serve as a promising candidates for 1P and 2P fluorescence-based microscopies, especially when chirality of the probe can serve as additional discrimination factor. 


References

[1] J. Olesiak-Banska, M. Waszkielewicz, P. Obstarczyk, M. Samoc, Chem. Soc. Rev., 48, 4087-4117 (2019)

[2] J. Olesiak-Bańska, M. Waszkielewicz, K. Matczyszyn, M. Samoc, RSC Adv., 6, 98748-98752 (2016)

[3] M. Waszkielewicz, J. Olesiak–Banska, M. Grzelczak, A. Sánchez–Iglesias, A. Pniakowska, M. Samoc, J. Lumin., 221, 116994 (2020)


66 Entangled Two-Photon Absorption in Commercial Fluorophores

Nitish Jain, Tobias Bernd Gäbler, Josué Ricardo León Torres, Patrick Hendra, Markus Gräfe
Fraunhofer Institute of Applied Optics and Precision Engineering IOF, Albert-Einstein-Straße 7, D-07745 Jena, Germany

Abstract Text

We demonstrate a comprehensive study of potential fluorophores for entangledtwo-photon fluorescence microscopy. Using CW-pumped ppKTP crystals, we have obtained linear absorption rates with entangled photons for highly used fluorophores in life science, like Rhodamine derivates or Acridine orange. Our work aims to establish new prospects for low photon flux multiphoton absorption-based imaging techniques.

Two-photon absorption (TPA) and other nonlinear spectroscopic techniques are very important tools for both fundamental and applied research, as they provide the possibility to examine atomic and molecular transition levels unattainable with single-photon absorption (SPA) [1]. Two-photon fluorescence microscopy is a nonlinear live-cell imaging technique based on simultaneous absorption of two photons to induce fluorescence. The use of a focused high-intensity infrared light beam to excite fluorophores provides deeper depth penetration, reduced photodamage, inherent z-sectioning, and lack of out-of-focus bleaching. However, the use of relatively high peak power pico- and femtosecond pulsed lasers to achieve sufficient amount of simultaneously absorbed infrared photons causes photodamage, photobleaching, and heating in the biological sample [2]. 

Our work addresses the shortcomings arising due to the use of high peak power pulsed lasers in classical TPA (CTPA) by exploiting the concept of entangled two-photon absorption (ETPA). The absorption rate for CTPA (Rc) of two independent single photons depends quadratically on their flux Ф, Rc=δΦ2 , where δ refers to the classical TPA cross-section with units cm4s. However, entangled photon pairs act in this case as a single quantum particle and, consequently, the linear absorption rate is obtained, ReeΦpair. Here, Φpair is the photon pair rate per unit area, and σe [cm2] refers to the ETPA cross-section. Therefore, the combined two-photon absorption rate is given as R2=δΦ2+ σeΦpair [3]. Thus, ETPA dominates at low photon fluxes with a linear absorption rate dependence on the photon pair rate.

Our experimental setup shown in Figure 1, comprises two modules: an SPDC source and a microscope module. The generation of time-correlated photon pairs is driven by a fiber-coupled 405nm CW-laser. The collimated pump is focused onto a Uncaptioned visual 
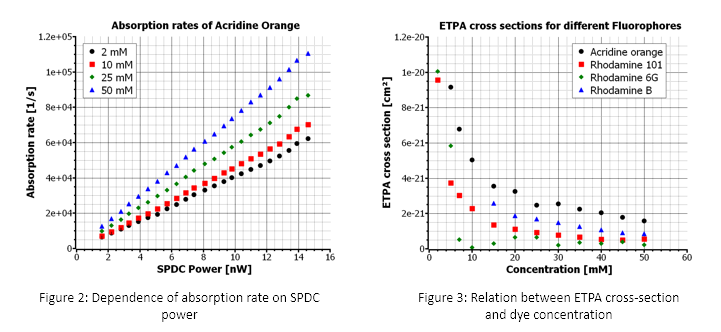
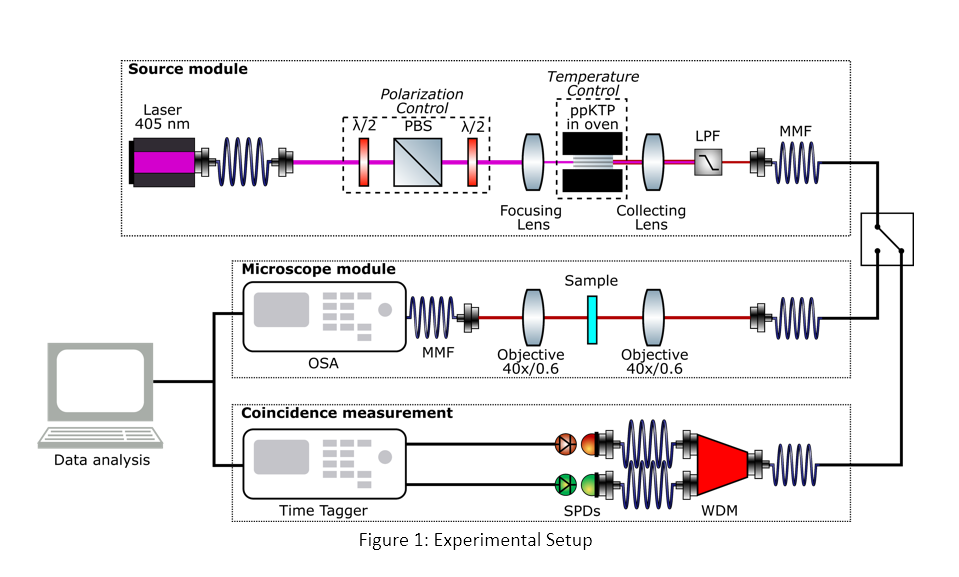
ppKTP crystal, prior to which a polarizing beam splitter between two half-wave plates is used to control the polarization of the pump beam and the power incident on the crystal. The SPDC photons, generated by the crystal placed in an oven for temperature control, are collimated using a lens and coupled into a multi-mode fiber after filtering out the pump photons. These photons are transferred to the transmission microscope module consisting of a focusing and a collection objective lens, where the photons are focused on the sample containing cuvette, and transmitted SPDC photons are collected. The transmission spectra of the sample are obtained using highly sensitive VIS-NIR spectrometer, and photon pairs coincidence rate is obtained using a time tagger to achieve optimal alignment for maximal photon-pair flux. The samples are prepared using chloroform as the solvent for acridine and rhodamine-based dyes with concentrations ranging from 2mM to 50mM.


Uncaptioned visual

We have clearly reported linear absorption rates for different concentrations of widely applicable commercial fluorophores. In figure 2, absorption rates for different concentrations of the fluorophore acridine orange illuminated by entangled photon-pairs at 810nm can be seen to show linear behavior, indicating ETPA. We further calculated ETPA cross-section for different fluorescent dye concentrations, as shown in figure 3. 

Our experimental results, together with our modular and fiber-coupled setup design, may pave the way towards low-cost, high-efficiency, and sensitive two-photon fluorescence microscopy. 


References

[1] Villabona-Monsalve, Juan P., et al. “Measurements of Entangled Two-Photon Absorption in Organic Molecules with CW-Pumped Type-I Spontaneous Parametric Down-Conversion.” The Journal of Physical Chemistry C, vol. 124, no. 44, Nov. 2020, pp. 24526–32. ACS Publications, doi:10.1021/acs.jpcc.0c08678.

[2] Tauer, Ulrike. “Advantages and Risks of Multiphoton Microscopy in Physiology.” Experimental Physiology, vol. 87, no. 6, 2002, pp. 709–14. Wiley Online Library, doi:https://doi.org/10.1113/eph8702464.

[3] Fei, Hong-Bing, et al. “Entanglement-Induced Two-Photon Transparency.” Physical Review Letters, vol. 78, no. 9, Mar. 1997, pp. 1679–82. APS, doi:10.1103/PhysRevLett.78.1679.


12 Multispectral confocal analysis of a real-time stem cell monitoring system

Luis Acevedo1, Marta Vallejo2
1OMIR Instruments / University of Edinburgh. 2Heriot Watt University

Abstract Text

It is well understood in the field of microscopy that the visualization of the finest details was often limited by the ‘intrusion’ of light from out-of-focus planes.  Biomedical research has driven the need for microscopes that can resolve very fine detail in three dimensions within intact, and often living, specimens.    The use of fluorescence labelling further exacerbates the problem of out-of-focus light because the signal is generated throughout the volume of the sample of a confocal or wide-field imaging.    The following paper describes the most prevalent techniques for 3D imaging and summarizes important optical considerations to achieve high-quality images. These measures allow the production of real-time 3D images with biochemistry techniques to localize the fluorescence protein and generate the labelling of the cell, using the combination of spectroscopy with imaging. However, these approaches are usually limited to low-magnification applications, such as dissection, spectral noise density, or cell biochemistry location. Most compound light microscopes produce flat, 2D images because high-magnification microscope lenses have inherently shallow depth of field, rendering most of the image out of focus and at low resolution. A large open aperture in an optical system can capture high-resolution images but yields a shallow depth of field. This paper proposes a low-cost modular method for retrofitting microscopy imaging systems to achieve 3D focus scanning, and it can correct multispectral density readouts of noise in the sensor. Such a system can lead to miniaturizing portable microscope devices capable of scanning hundreds of cell compounds during its growth, with high contrast and resolution, reducing the challenges of complex post-processing image filtering.

References

Dr Stewart Smith , University of Edinburgh 

Professor Neil Carragher , University of Edinburgh 


104 Light Sheet imaging of the developing gonads in fixed and cleared mouse embryos

Ivana Gantar1, Violaine Regard2, Chloé Mayère2, Audrey Tissot1, Laura Batti1, Serge Nef2, Stephane Pages1,2
1Wyss Center for Bio and Neuroengineering. 2University of Geneva

Abstract Text

The abstract content is not included at the request of the author.

References

1 Chung, K. et al. Structural and molecular interrogation of intact biological systems. Nature 497, 332–337 (2013).

2 Tomer, R., Ye, L., Hsueh, B. & Deisseroth, K. Nat. Protocols 9, 1682–1697 (2014)


181 New strategies to enable Live Cell Microscopy with a stable temperature at the field of view

Pranjali Divekar, Philipp Tripal, Benjamin Schmid, Ralph Palmisano
Optical Imaging Centre Erlangen (OICE), Friedrich-Alexander-Universität of Erlangen-Nürnberg, Erlangen, Germany

Abstract Text

Summary

Mammalian cells including primary cells and cell lines command immense importance in biological and medical research fields [1]. Temperature is a significant parameter for survival of these cells in vitro which is accounted for while culturing mammalian cells. They typically are cultured under an environmental control such as a 37°C incubator, 100% humidity in the and 5% CO2 [2]. Temperature is also monitored in live cell microscopy by imaging the cells in a similar 37°C incubation chamber supplemented with CO2. However, this still poses a major challenge. While the cell sample is imaged in an incubator at the optimum temperature, the temperature at the field of view is lowered. This occurs by heat transfer due to the immersion oil which acts a thermal bridge between the objective and sample [3]. The intracellular environment is sensitive to these changes in temperature. The most obvious process affected by increase or decrease in temperature is growth rate. At temperatures higher than 40°C, growth is sharply inhibited. Protein synthesis is also inhibited at high temperatures and a heat shock response is induced when the temperature is lowered [4]. Assembly of microtubules is drastically inhibited at temperatures above 39°C [5]. Fast temperature dynamics and effective heat compensation would be required to address this issue.

Introduction

Tracking of lysosomes within rat primary cortical neurons 

An appropriate spatial organization of proteins is vital to polarized cells like primary neurons [6]. Synaptic proteins and small molecule neurotransmitters have known to be synthesized locally within the metabolically active pre-synaptic axon terminal. Neurons, with their long axons rely on local protein biosynthesis. This local protein synthesis at sites away from the nucleus requires long distance transport of RNA granules whose traffic has been noted within the neuronal axons and dendrites. Until recently, the mechanism of how these RNA granules tether to the transport machinery was unknown. In 2019, a study carried out by Liao et al. [7] presented a mechanism for the transport of RNA which ‘hitch-hike’ on lysosomes via microtubule motor proteins by using annexin A11 present on the RNA granules (ANXA11) as a molecular tether. 

Due to the importance of temperature for cellular processes, all experiments based on live cell microscopy, should be performed at constant temperature. Minor temperature variations at the field of view could have an enormous impact on the speed of cellular processes. In this study, we aim to identify cellular processes, which are influenced by varying temperatures. The stabilization of temperature at the field of view by using VAHEAT (Interherence GmbH) was established to ensure stable conditions for live cell microscopy. To study the effect of temperature on the lysosomal transport within axons of primary cortical neurons, live cell imaging was carried out with total internal reflection fluorescence microscopy (TIR-FM) by using VAHEAT to ensure dynamic temperature control at the field of view.

Methods and Materials

Primary cortical neuronal cells were isolated from E17-18 rat embryos in cooperation with the Department of Psychiatry, UK-Er (Prof. Dr. Fejtova). Neurons were seeded at a cell density of 1.25 x 10⁵ cells/cm² with Dulbecco’s modified eagle medium (DMEM). DMEM was exchanged with Neurobasal maintenance media (NB; with glutamax and B27 supplement) after 3 hours. Lysosomes from the primary cortical neurons were stained with LysoTracker® (Molecular Probes©) and were tracked using the TIR-FM. Neurons were seeded in heated coverslips.

Results and discussion

Temperatures within a range of 30-41°C were tested. Lysosomal movement seemed to speed up with an increase in temperature by approx. 1-2°C. At 30-31°C, lysosomes were stationery and only showed an increase in speed at 37°C. At 39°C, velocity further increased but now displayed a substantial amount of Brownian movement and reached a plateau when temperature was increased up to 41°C. At higher temperatures i.e 40-41°C and also if held at 39°C for a prolonged period, morphological changes in the neuronal cell body and the axon were observed. These changes occurred to be irreversible. 

The aforementioned TIR-FM data suggest that lysosomal velocity is dependent on temperature. However more data will need to be acquired for confirmation. Kymographs were used for data analysis. The multi-kymograph plugin from ImageJ was used but since this analysis is highly manual, it is likely to lead to a high standard deviation. In this regard we are investigating further approaches such as ‘particle tracking’ using Trackpy, a python-based software for semi-automated particle tracking.


References

1) Wang J, Wei Y, Zhao S, Zhou Y, He W, Zhang Y, et al. (2017) The analysis of viability for mammalian cells treated at different temperatures and its application in cell shipment. PLoS ONE 12 (4): e0176120. https://doi.org/10.1371/journal. pone.0176120 

2) Brown IR. Induction of heat shock (stress) genes in the mammalian brain by hyperthermia and other traumatic events: a current perspective. J Neurosci Res. 1990 Nov;27(3):247- 55. doi: 10.1002/jnr.490270302. PMID: 2097376. 

3) https://analyticalscience.wiley.com/do/10.1002/imaging.6203

4) Lepock JR. How do cells respond to their thermal environment? International Journal of Hyperthermia. 2005 Dec;21(8):681–7. 

5) Li G, Moore JK. Tubulin recycling limits cold tolerance. Cell Biology; 2019 Oct. Available from: http://biorxiv.org/lookup/doi/10.1101/812867

6) Wu X, Cai Q, Shen Z, Chen X, Zeng M, Du S, Zhang M. RIM and RIM-BP Form Presynaptic Active-Zone-like Condensates via Phase Separation. Mol Cell. 2019 Mar 7;73(5):971-984.e5. doi: 10.1016/j.molcel.2018.12.007. Epub 2019 Jan 17. PMID: 30661983. 

7) Liao Y-C, Fernandopulle MS, Wang G, Choi H, Hao L, Drerup CM, et al. RNA Granules Hitchhike on Lysosomes for Long-Distance Transport, Using Annexin A11 as a Molecular Tether. Cell. 2019 Sep;179(1):147-164.e20 


182 News from the German BioImaging society: the GerBI-GMB spring school (TiM2022) and the core facility leadership and management course

Janina Hanne1, Stefanie Weidtkamp-Peters2,1
1German BioImaging - GMB e.V.. 2Center for Advanced Imaging, Heinrich-Heine University Duesseldorf

Abstract Text

German BioImaging - Gesellschaft für Mikroskopie und Bildanalyse e.V. (GerBI-GMB, Society for Microscopy and Image Analysis) is a scientific society representing the interests of researchers and professionals as well as core facilities in Germany involved in microscopy and image data analysis for the life sciences. The society fosters knowledge exchange within the community, and interaction between scientists and engineers both from academia and industry. Additionally, German BioImaging promotes communication with the public and organizes outreach activities. 

German BioImaging is organized in workgroups, covering different topics which are interesting for the community and are a valuable exchange for the participants. The seven established German BioImaging Workgroups are: (i) Financial and legal framework of core facilities, (ii) Funding strategies and career paths of core facility staff, (iii) Image data analysis and management, (iv) Intravital microscopy, (v) Quality assessment for instruments and facilities, (vi) Training and knowledge transfer, (vii) FLIM. 

Biannually, German BioImaging organizes the meeting series "Trends in Microscopy" (TiM), which was originally established in 2005. In 2020, we changed the concept of the TiM of a classical conference to the GerBI-GMB Spring School. TiM is now an intense microscopy training camp with hands-on workshops on different microscopy techniques, sample preparation, fundamentals of optics, and image analysis. The call for workshops for our next TiM2022 is already open (please see www.gerbi-gmb.de/tim2022), and we hope that it can happen in person again. 

The Core Facility Leadership and Management Course by German BioImaging and hfp consulting is offered annually. In this practical course, designed specifically for core facility managers in the life sciences, participants learn e.g., how to balance their different roles, build a productive team culture, deal with conflicts constructively, and negotiate more effectively. The 2021 course will take place again in a virtual format, registrations are already open (https://gerbi-gmb.de/CFLMC2021).  

In this poster, we introduce German BioImaging as a society, we give an overview of our different activities and focus on the details of the core facility leadership and management course and the experience report of the first TiM2020 GerBI-GMB spring school.  


References


184 Illuminating circular RNAs

Erika Vitiello1,2, Tiziana Santini3, Eleonora D'ambra3, Davide Mariani2, Francesco Castagnetti2, Irene Bozzoni1,2,3
1Department of Biology and Biotechnology ‘Charles Darwin’ - Sapienza University of Rome, Italy. 2Center for Human Technology@ Istituto Italiano di Tecnologia - Genova, Italy. 3Center for Life Nano- and NeuroScience, IIT@Sapienza - Rome, Italy

Abstract Text

The abstract content is not included at the request of the author. 

References

doi: 10.3390/ijms20215477 

doi: 10.1016/j.molcel.2015.03.027

doi: 10.1038/nn.3975

doi: 10.1186/s12943-019-1098-8

doi: 10.1093/nar/gkaa035  

doi: 10.1016/j.celrep.2020.01.083 

doi: 10.1038/ncomms14741

doi: 10.1007/978-1-0716-0664-3_15 

doi: 10.1038/s41587-019-0249-1

doi: 10.1016/j.chembiol.2020.06.010


185 Laboratory-scale cryo soft X-ray tomography

Kenneth Fahy1, Dunja Skoko1, William Fyans1, Tony McEnroe1, Fergal O' Reilly1,2, Paul Sheridan1
1SiriusXT. 2University College Dublin

Abstract Text

SiriusXT is developing a commercial bench-top cryo soft X-ray microscope for 3D cryo-soft X-ray tomography (cryo-SXT). Cryo-SXT uses X-rays in the ‘water window’ that extends from the K-absorption edge of carbon to the K-edge of oxygen, that is from about 282 eV (λ = 4.4 nm) to 533 eV (λ = 2.3 nm). Water is transparent to these X-rays, but organic molecules are absorbing. Therefore, these X-rays can be used as the basis for microscopy of whole cells in their near-native (frozen) state, without need for any contrast enhancing agents. A 3D tomogram with resolution between 25 nm to 60 nm (full pitch) is produced by rotating the cell over a range of angles, with an image acquired at each tilt angle [1, 2, 3]. The concept is equivalent to a medical CT scan applied at the nanoscale. Similar to Hounsfield units in medical CT, cellular organelles within the cell can be discernible from each other by their respective x-ray linear absorption coefficient values. While great progress has been made over the last two decades in developing cryo-SXT as an imaging technique on synchrotron hosted microscopes [4-7], only two laboratory soft x-ray microscopy systems have been reported so far [8-10]. The SiriusXT approach is novel insofar as no commercial lab-scale soft X-ray microscope has been available up to now, which is capable of delivering the necessary image quality and throughput required by the biomedical community. Bringing cryo-SXT capabilities to the laboratories as a table-top solution will promote development of unique flexible sample handling systems for imaging of adherent and in suspension cells, thus accelerating the establishment of integrated multiscale hybrid microscopy methods that could benefit by combining cryo-SXT with light and electron microscopy techniques [11, 12].   For example, cryo-SXT could be used as a fast pre-screening tool for EM imaging, where whole single cell SXT data is used to select the region of interest to be further imaged with electron microscopy or correlated light and electron microscopy.  

We will present our cryo correlative workflow in detail, including results of cryo-SXT as applied to a variety of biological specimens.


References

[1] Schneider G, Guttmann P, Heim S et al 2010 Nature Methods 7 985-987

[2] Müller WG, Heymann JBNagashima K et al 2012 J Struct Biol 177 179

[3] McDermott G, Fox DM, Epperly L et al 2012 BioEssays 34 320

[4] Carrascosa JL, Chichon FJ, Pereiro E et al 2009 Journal of Structural Biology 168 234

[5] Larabell CA & Nugent KA 2010 Current Opinion in Structural Biology 20 623 

[6] Schneider G, Guttman P, Heim S et al 2010 Nature Methods 985

[7] Carzaniga R, Domart MC, Collinson LM et al 2014 Protoplasma 251 449 

[8] Kördel M, Dehlinger A, Seim C et al 2020 Optica 7 (6) 658-674

[9] Fogelqvist E, Kördel M, Carannante V et al 2017 Scientific Reports 

[10] Legall H, Blobel G, Stiel H et al 2012 Optics Express 20 (16) 18362-18369

[11] Zeev-Ben-Mordehai T, Hagen C, Grunewald K 2014 Current Opinion in Virology 5 42-49

[12] Dent K, Hagen C, Grunewald K 2014 Critical Step-by-Step Approaches Toward Correlative Fluorescence/Soft X-Ray Cryo-Microscopy of Adherent Cells Methods in Cell Biology 124, 179-216 


186 Towards Designing smFRET Based Assays To Study the Binding of Fibroblast Growth Factors To Its Receptor

Mamello Mohale
University of Arkansas, Fayetteville

Abstract Text

The abstract content is not included at the request of the author.

References


189 RecA and RecB: tracking individual complexes of DNA repair proteins in live E.coli

Alex Payne-Dwyer, Aisha Syeda, Jack Shepherd, Lewis Frame, Mark Leake
University of York

Abstract Text

The abstract content is not included at the request of the author.

References

[1]  Lesterlin, C.; Ball, G.; Schermelleh, L.; Sherratt, D.J. RecA bundles mediate homology pairing between distant sisters during DNA break repair. Nature 2014, 506, 249–253, doi:10.1038/nature12868.

[2] Wollman, A.J.M.; Leake, M.C. Millisecond single-molecule localization microscopy combined with convolution analysis and automated image segmentation to determine protein concentrations in complexly structured, functional cells, one cell at a time. Faraday Discuss. 2015, 184, 401–424, doi:10.1039/C5FD00077G.


190 Use of a modified plaque assay for live observation of Shigella flexneri infection in HeLa cells.

Karla Valenzuela, Brendan Leung, Zhenyu Cheng
Dalhousie University

Abstract Text

Shigella flexneri is an intracellular bacterium that infects colonic epithelial cells causing inflammatory colitis in humans. Shigella multiplies in the host cell cytoplasm and disseminate into adjacent cells by induction of an actin tail. Shigella pathogenesis has been extensively studied in cell lines as there are no animal models available. Plaque assays are commonly used to determine the titer of animal viruses that can induce lysis of mammalian cells. But they can also be implemented for the study of Shigella pathogenesis. Plaques or areas of infection are formed as Shigella spreads in the monolayer. To date, plaque assays are performed in the presence of a dense agarose overlay that restricts extracellular diffusion of Shigella but also impedes real time observation of infection. We describe a modified plaque assay that allows live observation of Shigella cell-to-cell spreading and cell death induction. Fluorescent HeLa cells were infected with fluorescent bacteria and the cells were covered with Methocel, a translucent yet dense substance, supplemented with DAPI to analyze cell death. Control cells were covered with media without Methocel. Cell-to-cell spreading of Shigella was recorded in real time and also plaque number and area were quantified. We found fewer secondary areas of infection in the cells covered with Methocell compared to cells without it. Also, the area of the plaques was smaller and correlated better to the area of cell death. These indicates that the Methocel overlay can improve detection of primary infection points, genuine cell-to-cell spreading and cell death induction. Additionally, we successfully recorded Shigella spreading in real time. Stable expression of F-tractin-GFP in the HeLa cells allowed observation of actin tail induction by Shigella. The modified plaque assay described here can also be used to monitor other aspects of Shigella virulence and host cell responses to virulence factors. Furthermore, this assay could be implemented to study other intracellular pathogens, such as, Listeria, Rickettsia and Chlamydia


Shigella flexneri, a Gram-negative intracellular bacterium, is the causative agent of Shigellosis. This pathogen infects colonic epithelial cells causing inflammatory colitis in humans. Despite many efforts there are not licenced vaccines available to prevent Shigellosis and some species have developed antibiotic resistance. Further studies are needed to better understand Shigella pathogenesis in order to develop effective antimicrobial therapies. Since Shigellosis cannot be fully recapitulated in any small animal model, cultured cells have served as model system to study the different aspects of Shigella virulence. Plaque-based assays are commonly used to determine the titer of animal viruses that can induce lysis of mammalian cells. As the virus spreads, cells are lysed forming plaques on the monolayer of cells that can be counted and measured. Plaque assays have been adapted to study Shigella cell-to-cell spreading. These assays are performed in the presence of a dense agarose overlay that restricts extracellular diffusion of Shigella, followed by fixation and staining of the monolayers. In these conditions bacterial cell-to-cell spreading cannot be observed in real time. Here we describe a modified plaque assay that allows live observation of Shigella cell-to-cell spreading and cell death induction. 

F-tractin-GFP expressing HeLa cells were used in this study. Cells were seeded at a density of 5 x 10⁵ cells/mL on 96-well plates or 4 well glass-bottom dishes. Next day, a fluorescent ds-RED Shigella culture that had reached an OD600 of 0.5 was diluted 1 in 1000 times in DMEM. Cells were infected with the diluted culture for 30 min. After this time, cells were treated with gentamycin 100 ug/ml diluted in DMEM for 15 min to eliminate extracellular bacteria. The monolayers were then washed three times with PBS and covered with an overlay made with 0.4% Methocel diluted in Fluorobrite, supplemented with DAPI (0.1 ng/mL) to identify dead cells. Cells incubated with Fluorobrite supplemented with DAPI only were used as controls. The monolayers were imaged using a spinning disk or a widefield microscope every 15 minutes or at a final time point respectively. Image analysis were performed using ImageJ 2.1.0.

Shigella induced the formation of plaques in HeLa cells regardless of the presence of Methocel after 10 to 12 hours of infection. However, the monolayers that were not covered with Methocel showed an increase in the number of secondary areas of infection compared to Methocel treated monolayers (64% and 11% respectively). Also, the area of the plaques was smaller in the cells overlayed with Methocel. Induction of cell death was observed in both conditions and the size of the area of dead cells correlated with the area of Shigella spreading. These results show that Methocel can reduce Shigella spreading by blocking diffusion in the media. Therefore, Methocel overlay can improve detection of primary infection points, genuine cell-to-cell spreading and cell death induction. Additionally, by using this methodology we successfully recorded Shigella spreading in real time. Shigella infects a new cell every 30 to 45 min during the first 3 hours of infection. After this time Shigella spreading decreases showing a new infection every 2 to 2.5 hours. Stable expression of F-tractin-GFP in the HeLa cells allowed observation of the various modifications that Shigella induces in the cell actin cytoskeleton. As previously described, we observed that actin tail induction propels the bacterium from one cell to the next one propagating infection.    

The modified plaque assay described here allowed observation of Shigella spreading in real time as well as reliable quantification of number and size of plaques. This method also allowed easy quantification of cell death caused by Shigella. In contrast to the agarose regularly used in plaque assays, Methocel has the advantage of being translucent, thus permitting live observation of the infection process. Also, the methodology we describe does not require a fixation step, thus making the assay simpler and more accurate to determine the areas of Shigella dissemination. Similarly, this protocol could be used to examine other aspects of Shigella virulence and host cell responses to virulence factors. Furthermore, the modified plaque assay could be implemented to study other intracellular pathogens, such as, Listeria, Rickettsia and Chlamydia


65 FRET-FLIM based dynamic screening of signal transduction pathways: a proof-of-concept study

Olga Kukk, Rolf Harkes, Sravasti Mukherjee, Jeffrey Klarenbeek, Bram van den Broek, Kees Jalink
Netherlands Cancer Institute

Abstract Text

In this study, we present a FRET-FLIM based genetic screening platform for monitoring the dynamics of cellular cAMP (cyclic adenosine monophosphate) breakdown in real time. 


Genetic screens are instrumental in identifying different gene products that contribute to a biological response. However, conventional screening methods are mostly restricted to ‘static’ end-point readouts that rely solely on the magnitude of the response. Since the progression of the response over time is also crucial in determining the final biological outcome, it is imperative that we study ‘dynamic’ events in genetic screens. Studying such dynamic responses in real-time is enabled by Forster Resonance Energy Transfer (FRET) sensors with Fluorescence Lifetime Imaging (FLIM) being the most quantitative method to readout FRET. However, until recently, FRET detection lacked the robustness and speed necessary to extract quantitative data from single cells. Thus, with highly sensitive and photon-efficient FLIM instrumentation and a dedicated FRET-FLIM biosensor, we set out to demonstrate a dynamic genetic screening platform and automated analysis pipeline for monitoring the activity of proteins involved in cellular signal transduction, taking the cAMP pathway as an example. 


Using HeLa cells stably expressing our Epac based FRET sensor1, we investigated the effects of siRNA-mediated individual knockdown of a set of 22 different phosphodiesterases (PDEs) on cAMP breakdown kinetics in a multi-well format. For analyzing the screens, an automated analysis workflow was developed using custom Python scripts. Fluorescence lifetimes were measured by time correlated single photon counting using the Leica FALCON system2. Cell segmentation was performed by a deep-learning algorithm, Cellpose3. The lifetime traces for all individual live cells were then fitted to a logistic function to obtain the cAMP breakdown rate corresponding to the cellular PDE activity (Figure 1). 


Our FRET-FLIM screening pipeline produces a wealth of robust and reproducible data on cAMP metabolism. We identify PDE3A and PDE10A as the dominant PDEs that determine cAMP breakdown rates following cAMP production, whereas their knockdown has little or no effect on basal cAMP levels in HeLa cells (Figure 2). Additionally, this study demonstrates that FLIM recording has now become sufficiently fast and sensitive for single cell dynamic screening experiments, thus making FLIM a very attractive choice for FRET-based signaling studies.  

In conclusion, we present a robust FLIM-enabled screening platform that provides detailed kinetic analysis of cellular signals in individual cells. This platform will also pave the way for performing genome-wide screens focused on dynamics of signal transduction under physiologically relevant conditions.


 Uncaptioned visual 

Figure 1: Schematic overview of the FLIM screen for monitoring dynamic changes in cAMP


Uncaptioned visual

Figure 2: Breakdown of cAMP for different knockdowns of PDEs upon brief stimulation of the β-adrenergic pathway. Datapoints are fitted decay times of single cells. For each condition, the experiment was performed in duplicates, with cells grown, transfected, and assayed in two independent wells. Indicated are median value (vertical black line), mean value (green dotted line); boxes encompass middle 50% of values and whiskers represent 1.5 times the interquartile range.

References

1. Klarenbeek, J.B., Goedhart, J., Hink, M.A., Gadella, T.W. and Jalink, K., 2011. A mTurquoise-based cAMP sensor for both FLIM and ratiometric read-out has improved dynamic range. PloS one, 6(4), p.e19170.

2. Alvarez, L.A., Widzgowski, B., Ossato, G., van den Broek, B., Jalink, K., Kuschel, L., Roberti, M.J. and Hecht, F., 2019. SP8 FALCON: A novel concept in fluorescence lifetime imaging enabling video-rate confocal FLIM. Nat. Methods, 16, pp.1069-1071.

3. Stringer, C., Wang, T., Michaelos, M. and Pachitariu, M., 2021. Cellpose: a generalist algorithm for cellular segmentation. Nature Methods, 18(1), pp.100-106.


112 Omicron Single- and Multi-Wavelength Plug & Play Laser Light Sources for demanding Microscopy applications.

Ralf Dietzel
Omicron-Laserage Laserprodukte GmbH

Abstract Text

Omicron introduces its new development LaserNest®, a single-mode desktop laser for microscopy. The presentation also includes information about the multi-wavelength laser light engines LightHUB+ and LightHUB Ultra with up to seven wavelengths.

Uncaptioned visual Uncaptioned visual