Poster Session 2

17:20 - 18:20 Thursday, 24th June, 2021

Tracks Poster Session


9 Understanding the internal structure of amyloid superstructures with polarization analysis of two-photon excited fluorescence

Maciej Lipok, Patryk Obstarczyk, Manuela Grelich-Mucha, Joanna Olesiak-Bańska
Advanced Materials Engineering and Modelling Group, Wrocław University of Science and Technology

Abstract Text

The goal of our study is to develop label-free method for measuring the organization of amyloid fibrils based on their polarization-resolved two-photon excited autofluorescence. For our purpose, we have modified the model used for measuring fibril organization from polarization resolved one-photon fluorescence microscopy and applied it to successfully determine the internal structural organization of fibrils inside insulin spherulites.

Amyloids are ordered protein aggregates and a hallmark of multiple neurodegenerative disorders such as Parkinson’s or Alzheimer’s. Understanding the origin and course of amyloidogenesis is a key issue for creation of effective curative methods. A plethora of information about this process could be gathered from studying the organization of amyloid structures in different conditions.[1] In previous years, it was shown that ordering of amyloids stained with Thioflavin T could be efficiently determined using polarization-resolved fluorescence microscopy. [2] However, a label influences the aggregation process [3] and the data obtained from stained structures may differ from the naturally occurring label-free ones. Moreover, correct determination of fibril ordering in densely packed superstructures like amyloid plaques needs high precision which could hardly be achieved using standard fluorescence microscopes. Our method is overcoming this drawbacks, allowing to determine the local ordering of label-free amyloid fibrils in spherulites, amyloid superstructures, using their intrinsic polarization-resolved two-photon excited autofluorescence. [4] However, a new model was needed to analyse the obtained data. We have adapted the theory used with polarization-resolved fluorescence microscopy to two-photon microscopy and successfully applied it for calculating the arrangement of fibrils and their fluorophores in densely packed amyloid spherulites.

The sample preparation along with measurement setup and procedure is described in Supporting Information of our aforementioned paper. [4] To calculate the ordering of a spherulite structure we have successfully implemented theoretical models previously used by our group to calculate organization of DNA strands [5] which is a modification of model used for polarization-resolved fluorescence microscopy. [2] Data analysis was performed in Spyder Python 3 IDE. Fitting the theoretical models into experimental data was done using correlation of various model parameters such as shape, intensity, angle maxima location and checked for maximal R2 coefficient. Functions were based on NumPy and SciPy Python libraries.

The model assumes that total intensity of two-photon excited fluorescence is dependent on the probability of emission and two-photon absorption, intertwined with molecular distribution function, which is dependent on three structural parameters: rotation of the fibril in XY sample plane, orientational distribution of the emission dipole with respect to the long fibril axis and emission dipole orientational distribution aberrations due to the molecular rotations in filaments (Fig.1). Thus, polarization resolved two-photon fluorescence from highly ordered spots on sample where the average fibril orientation is known could be used to calculate the orientational distribution of fibrils. Appling this model to insulin spherulites have already shown differences between the calculated emission dipole orientational distribution of label-free and stained aggregates or that increasing the salt concentration narrows the emission dipole moment orientational distribution, which was in agreement with calculations of single fibrils imaged using Atomic Force Microscope.

               In conclusion, we have successfully modified and implemented the model used for polarization resolved fluorescence microscopy to determine the orientational distribution of autofluorescence in amyloids, measured under two-photon microscopy and showed that it differs depending on salt concentration or presence of a dye. Moreover, the presence of polarization dependent alignment of autofluorescence dipole moments supports the mechanism of amyloid autofluorescence, proposed by Grisanti et al.  [6] moving us one step closer to understand the origin of amyloid autofluorescence process.

Uncaptioned visual

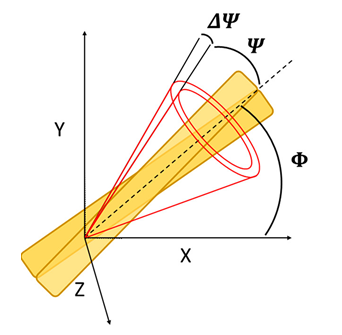
Figure 1. Open cone model of the conical distribution of the emission dipole of the dye (half angle, Ψ) in respect to the long fibril axis (dashed line). Rotation of the fibril in the XY microscope sample plane is described by the Φ angle. Aberrations of Ψ due to the molecular rotations in filaments are described by ΔΨ.

References

[1]        M. G. Iadanza, M. P. Jackson, E. W. Hewitt, N. A. Ranson, and S. E. Radford, “A new era for understanding amyloid structures and disease,” Nat. Rev. Mol. Cell Biol., vol. 19, no. 12, pp. 755–773, 2018

[2]        J. Duboisset, P. Ferrand, W. He, X. Wang, H. Rigneault, and S. Brasselet, “Thioflavine-T and Congo Red Reveal the Polymorphism of Insulin Amyloid Fibrils When Probed by Polarization-Resolved Fluorescence Microscopy,” J. Phys. Chem. B, vol. 117, no. 3, pp. 784–788, Jan. 2013

[3]        M. I. Sulatsky, A. I. Sulatskaya, O. I. Povarova, I. A. Antifeeva, I. M. Kuznetsova, and K. K. Turoverov, “Effect of the fluorescent probes ThT and ANS on the mature amyloid fibrils,” Prion, vol. 14, no. 1, pp. 67–75, Dec. 2020

[4]        P. Obstarczyk, M. Lipok, M. Grelich-Mucha, M. Samoć, and J. Olesiak-Bańska, “Two-Photon Excited Polarization-Dependent Autofluorescence of Amyloids as a Label-Free Method of Fibril Organization Imaging,” J. Phys. Chem. Lett., vol. 12, no. 5, pp. 1432–1437, Feb. 2021

[5]        H. Mojzisova, J. Olesiak, M. Zielinski, K. Matczyszyn, D. Chauvat, and J. Zyss, “Polarization-Sensitive Two-Photon Microscopy Study of the Organization of Liquid-Crystalline DNA,” Biophys. J., vol. 97, no. 8, pp. 2348–2357, 2009

[6]        L. Grisanti, M. Sapunar, A. Hassanali, and N. Došlić, “Toward Understanding Optical Properties of Amyloids: A Reaction Path and Nonadiabatic Dynamics Study,” J. Am. Chem. Soc., vol. 142, no. 42, pp. 18042–18049, Oct. 2020


11 PYCALIBRATE: FULLY AUTOMATED PSF ANALYSIS

Alexander Corbett
University of Exeter

Abstract Text

STANDARDISING IMAGE ANALYSIS: One of the key barriers to data reproducibility is the lack of standardization in microscope quality control (QC). Microscope QC requires standardization of both the sample used to measure microscope performance and the software used to analyse the images acquired. Despite there being several commercial (e.g. SVI Huygens) and freely available (PSFJ, MetroloJ) software solutions available there is currently no single package that is widely used by the microscopy community. Moreover, the solutions that do exist are semi-automated, requiring user input to define acquisition parameters and providing a window for error. This lack of automation and standardization makes performance comparisons between different microscopes unreliable.  

FULLY AUTOMATED ANALYSIS: In response to the above problems, PyCalibrate was developed. PyCalibrate is able to provide fully automated analysis of images of point-like objects (e.g. beads or PSFcheck slide features) that describe the microscope point spread function (PSF). Using a “scale-space” approach to the image analysis, the PyCalibrate algorithm is able to automatically determine the feature size of the PSF features in a 3D data set. Once the individual features have been identified, the lateral and axial full width at half maxima (FWHM) values are determined. By applying a 2D Gaussian fit to the XY plane, major and minor widths, as well as orientation of the major axis can be quantified. 

GLOBALLY ACCESSIBLE HISTORY: To avoid problems associated with platform-dependent performance and maintaining the most recent software version, PyCalibrate has been developed as a web app. This requires only an internet connection to upload raw data to the web app and then download the analysis as a PDF or CSV file. As previous records are maintained in the cloud, this allows the full history of your microscope to be recorded to track sudden changes or slow drifts in performance. Using a cloud-based solution, data can be uploaded, processed and the results retrieved from anywhere in the world.

References

[1] www.psfcheck.com


14 JIPipe: Designing automated image analysis pipelines without programming

Ruman Gerst1,2, Zoltán Cseresnyés1, Marc Thilo Figge1,2
1Applied Systems Biology, Leibniz Institute for Natural Product Research and Infection Biology – Hans-Knöll-Institute, Jena, Germany.. 2Faculty of Biological Sciences, Friedrich-Schiller-University Jena, Germany

Abstract Text

JIPipe is a powerful visual programming language that provides an intuitive way to create batch processing pipelines in ImageJ1 via an easy-to-use graphical interface that suitable for beginners and advanced users.

JIPipe makes the development of image analysis pipelines intuitive and easy to follow.

Figure 1: JIPipe makes the development of image analysis pipelines intuitive and easy to follow. (a) The general workflow to analyze data like such a set of C. elegans time series images with the purpose to extract the maximum covered area per worm. The process involves importing the data, applying thresholding and postprocessing, generating statistics, and finally storing the results on the hard drive. (b) A visual program designed in JIPipe that analyzes all images and automatically exports all results. (c) An ImageJ macro that applies an analysis equivalent to (b).

Modern microscopy technologies allow the visualization and quantification of a very wide range of biological systems and processes. Examples include host-pathogen interactions2,3, drug uptake by hepatocytes4, or the impact of diseases on kidney tissue5,6. The analysis of such images may involve hierarchies of hundreds of images and metadata files, making it hard to obtain statistics via manual inspection. Tools like ImageJ simplify the analysis considerably by providing a user-friendly graphical interface to commonly utilized image processing functions, such as extracting regions of interest, tracking algorithms, and automated evaluation of statistics. The user-friendliness of ImageJ is subject to a severe limitation: upscaling a single-data pipeline into an automated batch processing workflow of many images and image folder hierarchies is currently only possible by programming in a scripting language.

Here we present the Java Image Processing Pipeline (JIPipe), which provides a visual image processing language for ImageJ (see Figure 1). Visual programming languages are based on alternative concepts to scripting languages in that they represent programs as intuitive flowcharts with all technical details handled in the background. JIPipe is provided as a plugin that can be added to any existing ImageJ installation. Our tool comes pre-packaged with an extendible set of over 500 functions from ImageJ and popular plugins like Bio-Formats2, CLIJ27, MorphoLibJ8, and OMERO9. Each of these functions can be freely arranged and connected to each other in a flow chart to create linear or branching pipelines. Data and metadata are combined into tables, which allows easy up- and downscaling of pipelines by merely changing the set of input files. Additionally, users have access to features like integrated documentation and tutorials, automated saving of all results in a reproducible format, real-time preview of changes in parameters, easy organization of larger pipelines into functional units, customization of algorithms via mathematical expressions, and integration of existing ImageJ macros and scripting languages including R10 and Python (https://www.python.org/).

These features make JIPipe a powerful tool for beginners and advanced users to intuitively design image analysis pipelines. We will demonstrate this by presenting the whole process of designing such pipelines on example images from concrete biological applications.

References

1.        Rueden, C. T. et al. ImageJ2: ImageJ for the next generation of scientific image data. BMC Bioinformatics 18, 529 (2017).

2.        Linkert, M. et al. Metadata matters: access to image data in the real world. J. Cell Biol. 189, 777–782 (2010).

3.        Cseresnyes, Z., Hassan, M. I. A., Dahse, H.-M., Voigt, K. & Figge, M. T. Quantitative Impact of Cell Membrane Fluorescence Labeling on Phagocytosis Measurements in Confrontation Assays. Front. Microbiol. 11, 1193 (2020).

4.        Adrian Press, A. T. et al. Targeted delivery of a phosphoinositide 3-kinase γ inhibitor to restore organ function in sepsis through dye-functionalized lipid nanocarriers. bioRxiv 2021.01.20.427305 (2021) doi:10.1101/2021.01.20.427305.

5.        Klingberg, A. et al. Fully automated evaluation of total glomerular number and capillary tuft size in nephritic kidneys using lightsheet microscopy. J. Am. Soc. Nephrol. 28, 452–459 (2017).

6.        Dennhardt, S. et al. Modeling hemolytic-uremic syndrome: In-depth characterization of distinct murine models reflecting different features of human disease. Front. Immunol. 9, (2018).

7.        Haase, R. et al. CLIJ: GPU-accelerated image processing for everyone. Nat. Methods 17, 5–6 (2020).

8.        Legland, D., Arganda-Carreras, I. & Andrey, P. MorphoLibJ: Integrated library and plugins for mathematical morphology with ImageJ. Bioinformatics 32, 3532–3534 (2016).

9.        Allan, C. et al. OMERO: flexible, model-driven data management for experimental biology. Nat. Methods 9, 245–253 (2012).

10.      R Core Team. R: A Language and Environment for Statistical Computing. (2017).


15 Integrated Confocal Performance Assessment

Alfonso J. Schmidt1, Kylie M. Price1, Graham D. Wright2
11) Malaghan Institute of Medical Research, Hugh Green Cytometry Centre, Wellington New Zealand.. 22) A*STAR Microscopy Platform (AMP), Research Support Centre, Agency for Science, Technology & Research (A*STAR), Singapore.

Abstract Text

The creation of standard operating procedures for the evaluation of instrument performance, and their importance, is an area currently gaining traction within the microscopy community globally.  It is being led by worldwide initiatives like QUAREP-LiMi [1] with the intention of providing guidelines for quality assessment and experimental reproducibility. However, current literature around this topic shows quality assessment approaches that evaluate individual components and the results are reported separately which reduces the scope and overall interpretation of the results of the assessment.


Inspired by published assessments and based on experience in the field, six parameters have been selected to create a holistic, evaluation tool to assess confocal microscope performance; (1) Laser power and stability, (2) uniformity of field of view, (3) lateral and axial co-registration, (4) motorized stage precision and z-drift, (5) detector sensitivity and linearity, and (6) point spread function (PSF). Furthermore, we propose a parametrization of these results to provide clear categories (e.g. Optimal, Acceptable and Fail) that will facilitate decision making regarding instrument performance. We propose a spider chart that provides information for each particular evaluated parameter while simultaneously providing the complementary equipment overview perspective.


It is expected that the assessment parametrization and spider chart outputs will provide a useful tool to the field. In a core facility environment, it can be used to provide information to end-users regarding equipment performance expectations, to identify the best match between equipment and experiment goal, it can provide useful performance tracking information to support instrument service management and pre-emptive maintenance. Further is can be used as a tool to aid decision making in the technology purchase and asset lifecycle control, by comparing equipment based on performance and unbiased conditions over time, especially powerful when combined with insights on utilisation dynamics.


This Integrated Confocal Performance Assessment project is being undertaken as the Technical Essay of the Royal Microscopy Society Diploma Program by Alfonso Schmidt.


References

[1] QUAREP-LiMi: A community-driven initiative to establish guidelines for quality assessment and reproducibility for instruments and images in light microscopy, arXiv:2101.09153 [q-bio.OT]


17 Medical image registration and pixel classification for the study of protein co-localization and morphology heterogeneity in cancer biopsies

Laura Nicolás-Sáenz1,2, Nerea Carvajal3, Javier Pascau1,2, Federico Rojo3, Arrate Muñoz-Barrutia1,2
1Departamento de Bioingenieria e Ingenieria Aeroespacial, Universidad Carlos III de Madrid, 28911 Leganes, Spain. 2Instituto de Investigación Sanitaria Gregorio Marañon, 28007 Madrid, Spain. 3Department of Pathology, CIBERONC, UAM, Fundación Jiménez Díaz University Hospital Health Research Institute, Madrid, Spain

Abstract Text

We present a novel method to assess the variations in morphology protein expression and spatial heterogeneity of tumor biopsies with application in computational pathology. Different antigen stains in each tissue section are combined, applying complex image registration followed by a final pixel classification step, obtaining the exact location of the proteins of interest. Accurate image registration, necessary for the correct assessment of the antigen patterns, is a difficult process in histopathological images for three main reasons: the high number of artifacts due to the complex biopsy preparation, the large image size, and the complexity of the local morphology. Our previously published method [1] manages to accurately register the tissue cuts and segment the positive antigen areas. In this work, we have further proved the robustness of our solution on a new dataset of breast cancer biopsies, adding a quality measure based on the tissue artifacts, including automatic piece-based registration, and introducing segmentation for all kinds of stains. 

Method

Our method consists of 4 steps: First, a robust segmentation with object detection, which is then followed by an object-wise registration. The registered images are then subjected to pixel classification for stain segmentation. Finally, the masks for the different stains are used to study morphology variations and protein-colocalization.

The segmentation of the tissue from the background is obtained analyzing L intensity level from the LAB color space histogram. In tumor biopsies, it is common to have two types of tissue sources: surgical biopsies - which include generally one big block of tissue, and needle biopsies, consisting of several slim pieces of tissue. For this reason, our method detects the number of objects in the biopsy in the segmentation mask and decides whether to proceed with the registration as a single block or for each slim piece individually. 

Once the image is segmented, 3 different binary masks are created for each detected object: A simple one that takes the object as a whole mass without taking into account holes and artifacts (Simple mask), a complex one that involves the careful segmentation of all the minute structures (Whole-tissue mask), and a third one that detects artifacts, holes and fat-predominant areas and will be used for registration quality control (No-artifacts mask).

The registration algorithm calculates a transformation T consisting of a robust pre-alignment and a global and a local transformation. The combined transformation T can be expressed as T=TAlign*TGlobal*TLocal. The alignment and global transformation describe the overall motion of the biopsy and are calculated on the first segmentation mask (Simple mask). The local motion involves the alignment of the internal structure of the biopsy and is applied to the second type of mask (Whole-tissue mask). Further refinement is then calculated using the greyscale image of the segmented tissue.   The third mask (No-artifacts mask) is then used to assess the areas where the registration may be faulty (folds, rips, holes, and predominately-fatty areas), obtaining a pixel-wise quality control of the registration step.  

The pixel classification for stain segmentation algorithm is based on the geometry of the different color spaces’ histograms of the images. This algorithm is applied to the already registered images after applying the third mask (No-artifacts mask), thus, obtaining the segmented stains only in those areas that will be useful for the creation of the heterogeneity map. The registered stain masks are used together to form the heterogeneity map.  

Results

The final Heterogeneity Map is created from the stains segmented on the registered tissue cuts. Each transformed section is subjected to our pixel classification for stain segmentation algorithm, which results in a binary mask of the areas positive for the antigen. These masks are overlaid over the fixed image of the patient, obtaining a heterogeneity map that shows protein expression throughout the biopsy. The maps show the antigen distribution in each tissue cut with one simple and easily-to-interpret image. The hot spots of these maps would coincide with the aberrant morphology characteristics of stroma and tumor development as annotated by a pathologist (as seen in Fig. 1).  

Conclusion 

The proposed pipeline is robust and, most importantly, automatic and non-supervised. Compared to other segmentation and registration algorithms, our solution yields similar registration results and improved segmentation results without requiring manual annotations nor training, as shown in [1]. The obtained tumor maps provide a helpful visual representation of the intra-tumor environment and heterogeneity of the tissue. By showing the exact location of the stains within the tissue and how different dyes may correlate, this tool presents a new approach to study the tumor microenvironment. Moreover, these maps would aid in assessing tumor biopsies by automatically detecting the stroma of the tumor, identifying interesting areas and slices, or even as a tool to speed up biopsy analysis for cancer diagnosis. This could reduce diagnostic times with more accurate decisions; the use of these maps would be highly beneficial for speeding up and relieving the clogged system by making the whole process more efficient. These maps can also serve as automatic, non-supervised computer-generated input for training deep convolutional neural networks (DCNNs). Nowadays, these methods rely on manual annotations for training, which means they are dependent on the availability of pathologists. With our maps, tumoral areas and normal tissue can instead be automatically segmented and DCNNs can be trained to detect the corresponding structural information in clinical settings automatically. 

Uncaptioned visual

Fig. 1 Process for the creation of the tumor heterogeneity maps for the two different types of images included in the breast cancer dataset: surgical biopsies and needle biopsies. In the output of the algorithm, it can be appreciated how the hotspots of the biopsies’ staining correspond to clinician-annotated areas of morphology aberrations, specifically the stroma surrounding the cluster morphology of the intratumoral space.

References

[1] Nicolás-Sáenz, L.; Guerrero-Aspizua, S.; Pascau, J.; Muñoz-Barrutia, A. Nonlinear Image Registration and Pixel Classification Pipeline for the Study of Tumor Heterogeneity Maps. Entropy 2020, 22, 946. 

https://doi.org/10.3390/e22090946 


33 EasyXT-Fiji: Simplifying back and forth communication between Imaris and Fiji

Olivier Burri, Romain Guiet, Nicolas Chiaruttini, Arne Seitz
BioImaging & Optics Platform (BIOP), Ecole Polytechnique Fédérale de Lausanne

Abstract Text

ImageJ and more recently Fiji have been essential open source tools to the bioimage community for over 30 years now. Imaris is a closed source commercial software, overhauled to handle massive 3D datasets and it is broadly used in core-facilities and laboratories thanks to its user-friendliness and responsiveness. Unfortunately, well designed user interfaces tend to come at the expense of flexibility. An optional module (XTensions), allows Imaris to communicate with other softwares using an Application User Interface (API), enabling power users to communicate with the software at a lower level and create bridges between various applications. However, APIs tend to be hard to get to grasps with, and their design is hardly standardized, especially when bridging different programming languages (In this case C++ for Imaris and Java for the Imaris API). 


In order to leverage image processing and visualization speed of Imaris and flexibility of Fiji to solve complex biological questions using 3D microscopy. We present EasyXT-Fiji, a Java-best-practices API that wraps the native Imaris library and offers interconnectivity between Imaris and Fiji. It features a Builder Model approach to enable spot and surface detection in much the same way the UI-guided Imaris “Detection Wizards” natively function. Furthermore, well organized static classes enable easy translation between Fiji Objects (Results Tables, Images, Masks) and Imaris Objects (Statistics, Datasets, Surfaces, Spots). by using, amongst others, the mcib3d library. EasyXT is distributed as a Fiji update site, allowing for simplified installation on Imaris workstations. Being written in Java, it is accessible by all scripting languages available within Fiji (e.g. Groovy, JavaScript, …) excluding the ImageJ macro language. Finally EasyXT scripts are readily shared, improving reproducibility and allowing for batch processing of complex workflows. 


Multiple projects made in our Core Facility for different users illustrate its ease of use, rapid prototyping, and capacity to draw specific tools from the Open Source community lacking in the commercial software and lowering the difficulty for coders to take advantage of the Imaris API.


38 Quantitative comparison of image processing methods to automatically track intensity changes in submicron-sized cellular structures.

Trupti Gore1,2, David Dang1, Viji Draviam1
1School of Biological and Chemical Sciences, Queen Mary University of London, London. 2University College London, London

Abstract Text

Human kinetochores are submicron-sized cellular structures made up of over 100 proteins. These structures ensure the proper attachment of chromosomes to microtubules which is essential for the accurate segregation of chromosomes.  To understand how the kinetochore structure and function are regulated, it's important to quantify changes in kinetochore components through time. Here we first compare a variety of image analysis methods to quantify changes in kinetochore protein intensities in time-lapse microscopy movies. We present an image analysis workflow starting with image segmentation – which involves filters to denoise the image, a threshold to create a binary image and then applying the mathematical morphological operations, such as erosion and dilation to fill the holes or remove tiny particles. Particles are labelled and analysed for their size, shape and intensity. The diversity of image content means that there is no ‘one size fits all’ method, hence the sequence of techniques in the workflow can be changed to obtain the optimal results for the image dataset. Second, we identify at least two automated methods to assess the quality of the image analysis regimens, reducing the effort involved in assessing quality manually. Based on apriori kinetochore knowledge and image analysis results, a method is finalised for that dataset. Third, we generalise the image analysis regimen to multiple kinetochore protein combinations, highlighting the strengths of image processing and kinetochore protein intensity measurement methods proposed here. The workflow we propose is likely to be useful for tracking and measuring changes in submicron structures in microscopy.


40 Does Crocin Have Beneficial Effects Against Doxorubicin-Induced Testicular Damage in Rats?: Herbal Medicine on Male Fertility

Melike Ozgul Onal1, Sara Asaad Abdulkareem Aljumaily2, Gurkan Yigitturk1, Volkan YASAR1, Yasemin Bicer2, Eyup Altinoz2, Mehmet Demir3, Hulya Elbe1, Feral Ozturk1
1Mugla Sitki Kocman University, Faculty of Medicine, Department of Histology and Embryology, Mugla, TURKEY. 2Karabuk University, Faculty of Medicine, Department of Biochemistry, Karabuk, TURKEY. 3Karabuk University, Faculty of Medicine, Department of Physiology, Karabuk, TURKEY

Abstract Text

We aimed to evaluate the effects of crocin against doxorubicin-induced testicular damage in rats. MDA (malondialdehyde), GSH (glutathione), SOD (superoxide dismutase), CAT (Catalase), TAS (total antioxidant status) and TOS (total oxidant status) analyses were performed. The measurements of seminiferous tubule diameters were calculated and the testicular damage was evaluated. 

Doxorubicin (DOX) is a wide-spectrum antibiotic used for chemotherapy. The side effects of it have been reported specifically in some tissues such as ovaries, testes and intestinal mucosa. Doxorubicin-induced damage is related with oxidative stress, DNA damage, and apoptosis. These mechanisms effect the spermatogenesis by reducing the testosterone levels, sperm count and sperm motility. Anticancer treatments are crucial for male patients. Crocin is one of the carotenoids that has both anti-inflammatory and antioxidant activities. Crocin is used for the treatments of dysentery, measles, enlargement of the liver and gallbladder, urological infections, asthma and cardiovascular disorders. Vimentin is an intermediate filament, which is found in Sertoli cells, peritubular‐myoid cells and Leydig cells. Its altered distribution in Sertoli cells is associated with impaired spermatogenesis.

40 Wistar albino rats were randomly divided into four groups. Group 1:Control (saline solution 1 ml/kg/24h, i.p. for 15 days), Group 2:Crocin (40 mg/kg/24h, i.p. for 15 days), Group 3:DOX (2 mg/kg/48h i.p. in six injection, cumulative dose 12 mg/kg), and Group 4:DOX+Crocin (DOX 2 mg/kg/48h i.p. in six injection and crocin 40 mg/kg/24h ip for 15 days).  Testis tissues were removed and stained with Hematoxylin-Eosin. The diameters of seminiferous tubules were measured and the damage was evaluated. The mean histopathological damage score (MHDS) was calculated according to the atrophy, edema, vacuolization and disorganization of seminiferous tubules. For this analysis, each slide was semiquantitatively graded as follows: absent (0), mild (1), moderate (2), and severe (3). The maximum damage score was 12. In addition, vimentin expression of Sertoli cells was evaluated by immunohistochemistry and H-Score was calculated. Levels of MDA and GSH, CAT, and SOD activities were determined in tissue. TAS and TOS were calculated. All data are expressed as arithmetic mean±SE. Kruskal-Wallis and Mann-Whitney U tests were used for comparison of data. p<0.05 was regarded as significant. DOX treatment caused significant increases in oxidant status (MDA and TOS) as well as significant decreases in antioxidant systems (GSH, SOD, CAT and TAS) (p<0.05). Administration of crocin with DOX significantly ameliorated all biochemical parameters. In DOX group, we detected atrophy of seminiferous tubules in many areas. The damaged tubules exhibited disorganization, vacuolization, and edema. The MHDSs of control group and DOX group were 0.20±0.13 and 4.60±0.45, respectively. There was a significant difference between these two groups (p<0.05). Crocin administration decreased the histopathologic score. Immunoexpression level of vimentin and seminiferous tubule diameter in DOX+Crocin group significantly increased compared to DOX group, whereas tubule damage significantly decreased (p<0.05, for all). 

Our results reveal that crocin has beneficial effects on DOX-induced testicular damage. Taken together, present study demonstrated that crocin has potential protective effects against DOX-induced testicular damage by modulating oxidant and antioxidant systems, and reorganization of vimentin in Sertoli cells.


References

1. Belhan S, Özkaraca M, Özdek U, Kömüroğlu AU. Protective role of chrysin on doxorubicin-induced oxidative stress and DNA damage in rat testes. Andrologia. 2020 Oct;52(9):e13747. doi: 10.1111/and.13747. Epub 2020 Jul 16. PMID: 32672853.

2. Levi M, Tzabari M, Savion N, Stemmer SM, Shalgi R, Ben-Aharon I. Dexrazoxane exacerbates doxorubicin-induced testicular toxicity. Reproduction. 2015 Oct;150(4):357-66. doi: 10.1530/REP-15-0129. PMID: 26329125.

3. Colapietro A, Mancini A, D'Alessandro AM, Festuccia C. Crocetin and Crocin from Saffron in Cancer Chemotherapy and Chemoprevention. Anticancer Agents Med Chem. 2019;19(1):38-47. doi: 10.2174/1871520619666181231112453. PMID: 30599111.

4. Elsherbiny NM, Salama MF, Said E, El-Sherbiny M, Al-Gayyar MM. Crocin protects against doxorubicin-induced myocardial toxicity in rats through down-regulation of inflammatory and apoptic pathways. Chem Biol Interact. 2016 Mar 5;247:39-48. doi: 10.1016/j.cbi.2016.01.014. Epub 2016 Jan 22. Erratum in: Chem Biol Interact. 2016 Apr 25;250:85. PMID: 26807765.

5. Zhang L, Previn R, Lu L, Liao RF, Jin Y, Wang RK. Crocin, a natural product attenuates lipopolysaccharide-induced anxiety and depressive-like behaviors through suppressing NF-kB and NLRP3 signaling pathway. Brain Res Bull. 2018 Sep;142:352-359. doi: 10.1016/j.brainresbull.2018.08.021. Epub 2018 Sep 1. PMID: 30179677.

6. Lydka M, Kotula-Balak M, Kopera-Sobota I, Tischner M, Bilińska B. Vimentin expression in testes of Arabian stallions. Equine Vet J. 2011 Mar;43(2):184-9. doi: 10.1111/j.2042-3306.2010.00135.x. PMID: 21592213.


44 An open source Fiji/ImageJ plugin for 2D mouse brain sections to 3D Allen Brain Atlas registration

Nicolas Chiaruttini1, Bianca Ambrogina Silva2, Olivier Burri1, Arne Seitz1
1BioImaging & Optics platform (BIOP), Faculty of Life Sciences (SV), Ecole Polytechnique Fédérale de Lausanne (EPFL), Lausanne, Switzerland. 2Laboratory of Neuroepigenetics, Brain Mind Institute, School of Life Sciences, École Polytechnique Fédérale Lausanne, 1015, Lausanne, Switzerland

Abstract Text

Mapping image data to the allen brain atlas is a very common, important and often time-consuming and non trivial task in neurological research. Open source and proprietary software tools have been developed to tackle this challenge with the disadvantages of being far from a one-size-fits-all solution. 
    Each software is typically tailored for a specific use case (3D vs 3D or 2D vs 3D registration, automated / manual,  affine or free-form transformation). With the Allen Brain BIOP Aligner (ABBA), we offer a unique combination of features in the current software landscape for 2D to 3D registration: support of multiresolution images in their native file format, a convenient user interface for positioning slices along the atlas and asynchronous computation of (potentially nonlinear) registrations. This is realized by using the abstract imglib2 image library and the bigdataviewer ecosystem of Fiji, which readily provides atlas reslicing in arbitrary orientations and on-the-fly computing of image transformations. 

It takes 30 minutes for a trained user to perform a fully non-linear registration of 80 sections, including manual curation, on a ‘standard’ computer. The software contains modules to facilitate the communication with QuPath, which can be used for defining the initial data set, and for further downstream analysis after registration. The automated registration backend uses the elastix library, and manual edition of registration uses Fiji’s BigWarp plugin. Future development will include better compatibility with other software and an extensibility mechanism for adding registration methods.


References


47 Minimizing the number of Stainings for Segmentation using Deep Learning tools.

Romain Guiet, Olivier Burri, Audrey Menaesse, Arne Seitz
Bioimaging & Optics Platform (BIOP), EPFL-SV, Station 15, 1015 Lausanne

Abstract Text

The acquisition of multiple channels is routine in modern light microscopy experiments in life sciences. Unfortunately, some of these channels are only used for segmentation. Stainings Used for Segmentation (SUS) are acquired with the sole purpose to define e.g. the nuclei or cytoplasm area of the cell. These experiment-independent SUS are needed to be in line with good practice in Image Analysis. They nevertheless reduce the number of possible Stainings Used for Experimentation (SUE) and therefore the possibility to study further analyts in the same experiment. This is in particular true for live cell experiments where preserving specimen viability and maximizing the number of SUE is even more challenging. 


Deep learning-based image methods have brought unprecedented precision and control to the previously daunting task of nuclear and cell segmentation. However, the variability of samples, preparations, stainings and imaging modalities still puts the hope of a universal segmentation model far in the future. Thus it is often the case that models need to be retrained to include the new variations, implying the generation of ground truth annotations which are time consuming. 

In parallel to segmentation, deep-learning based image-to-image models enable the possibility to translate one image modality onto another (e.g. for image restoration like CARE). By construction, this has the advantage of not necessitating human-annotated ground truth data, which lowers the difficulty of training new models. 


We present different strategies to achieve SUS reduction, either by combining DeepLearning with more standard image analysis tools, or end-to-end DeepLearning. We discuss two different approaches using “in silico channel” prediction (CARE) or direct object segmentation (using Cellpose and StarDist).


48 EOSC-Life is creating an open, collaborative space for digital life science

Johanna Bischof, Antje Keppler, Frauke Leitner
Euro-BioImaging ERIC Bio-Hub @ EMBL

Abstract Text

EOSC-Life is an H2020-funded project bringing together the 13 Life Science ‘ESFRI’ Research Infrastructures (LS RIs) to create an open, digital and collaborative space for life science research. The project co-creates and integrates the EOSC federated core, while simultaneously creating, adapting and adopting policies for Open Science with a particular focus on the unique challenges of Life Science research. As one of the LS RIs, Euro-BioImaging ERIC represents the biological and biomedical imaging community and ensures that developments adhere to the requirements of the imaging field.


Uncaptioned visual

All activities aim to fulfil our 4 project goals:

  • Establish EOSC-Life by publishing FAIR life science data resources in EOSC
  • Provide the policies, guidelines and processes for secure and ethical data reuse
  • Populate an ecosystem of innovative life-science tools in EOSC
  • Enable data-driven research in Europe by connecting life scientists to EOSC via open calls for participation


The Life Science Research Infrastructures provide access for researchers to advanced instruments and research facilities that describe biology from single molecules to ecosystems and long-term population cohorts. This leads to the creation of very rich and diverse Life Science data sets that need to be processed and analysed. EOSC-Life provides solutions so that life scientists can make use of data, tools and workflows in the cloud. A crucial step is to make data, tools and analysis workflows more findable, accessible, interoperable and reusable (FAIR) through cloud deployment of these resources. 


By populating EOSC-Life, we are not merely fulfilling a project’s goals -- we are building the tools and training the people to make this the new normal for Life Science data. European scientists should be able to collaborate and reuse data regardless of where they are based. Training programmes, workshops and hackathons help to prepare our users for a new way of working. Open calls and demonstrator projects guide our developments and create examples for other projects - illustrating the capabilities of EOSC-Life. In the presentation, example projects from the imaging field that benefited from support, training, consultation and funding from EOSC-Life will be illustrated.

Uncaptioned visual


EOSC-Life is funded by the European Union’s Horizon 2020 research and innovation programme under grant agreement No 824087.


49 Review of Effective Ways for Computing Point Spread Functions

Ratsimandresy Holinirina Dina Miora1,2, Gurthwin Bosman1, Erich Rohwer1, Rainer Heintzmann2,3
1Department of Physics, University of Stellenbosch, Private Bag X1, Matieland 7602, South Africa. 2Institute of Physical Chemistry and Abbe Center of Photonics, Friedrich Schiller University Jena, Helmholtzweg 4, 07743 Jena, Germany. 3Leibniz Institute of Photonic Technology, Albert-Einstein Str. 9, 07745 Jena, Germany

Abstract Text

Any image of a point source in a diffraction-limited system will result in a blurred pattern, the point spread function (PSF). In the case of fluorescence microscopy, the incoherent imaging can be described by a convolution of the object with the PSF, a common approach to significantly improve the image quality tries to undo this convolution. This “deconvolution” can in some cases even beat the diffraction limit as it makes plausible assumptions about the object such as positivity of fluorescence. A successful deconvolution, requires a good model of the PSF. 

A practical way to obtain a PSF is by measuring it experimentally and averaging over images of multiple beads. This approach can be used to estimate the aberration present in the system, which is generally difficult to model.  However, the noise distribution level and small depth of field in the region of interest limits the use of the approach. Studies have been conducted for computing PSFs, but a comprehensive overview of those different techniques is still missing. In this work, we aim to compare various theoretical techniques for computing PSFs and present novel approaches. Not only an accurate and realistic estimation of the PSF is needed, but its computation should also be fast, and memory efficient as experimental data can be large. A good PSF calculation routine will have a big impact in image processing and deconvolution. 

As described by McCutchen [1], the 3D diffraction pattern, obtained by imaging a point source by a lens, is the 3D-Fourier transform of a generalisation of the lens aperture. Our techniques for computing PSFs therefore consist of Fourier based techniques. The fast Fourier-transformation (FFT) is a very handy tool to speed up PSF calculations, but its pitfalls must carefully be circumvented [2]. Mathematical operators such as Chirp-Z transform can be used to tackle some of the pitfalls of the FFT [3]. Four techniques were developed, and they all start by constructing the generalized lens aperture. The amplitude spread function (ASF) is the 3D-Fourier transform of the generalized aperture and the PSF consists of the absolute square of the ASF. We compare the PSF models with the results obtained from the work of Richards and Wolf [4, 5] with excessive oversampling, as a slow but precise gold standard. 

Each technique has its own pros and cons. As expected, Fourier based techniques are fast to compute but the wrap-around effect of the Fourier transform operator cause large errors at higher depth if the window size of the image is too small. The Chirp-Z transform prevents this wrap-around effect adding computational costs but gaining precision. Non-FFT-based calculations, using the Bessel series for instance, may not suffer from inaccuracies due to wrap-around, but often need excessive sampling to not violate energy conservation around the focus. 

This overview and comparison allow us to conclude which calculation technique is best suited for a given size and sampling requirement.

References

[1] McCutchen CW. Generalized aperture and the three-dimensional diffraction image. JOSA. 1964 Feb 1;54(2):240-4.

[2] Goodman JW. Introduction to Fourier optics. Roberts and Company Publishers; 2005.

[3] Rabiner L, Schafer RW, Rader C. The chirp z-transform algorithm. IEEE transactions on audio and electroacoustics. 1969 Jun;17(2):86-92. 

[4] Wolf E. Electromagnetic diffraction in optical systems-I. An integral representation of the image field. Proceedings of the Royal Society of London. Series A. Mathematical and Physical Sciences. 1959 Dec 15;253(1274):349-57.

[5] Richards B, Wolf E. Electromagnetic diffraction in optical systems, II. Structure of the image field in an aplanatic system. Proceedings of the Royal Society of London. Series A. Mathematical and Physical Sciences. 1959 Dec 15;253(1274):358-79.


53 Deep Learning for Cell Segmentation of Large Multi-Channels Time-Series Data in the Amira™ Software

Jan Giesebrecht, Sarawuth Sarawuth Wantha, Rengarajan Pelapur
Thermo Fisher Scientific Materials & Structural Analysis Quai 8.2 , 39 rue Armagnac 33800 Bordeaux FRANCE

Abstract Text

Quantitative live cell imaging has been widely used to study various dynamical processes in cell biology. Deep Learning has been successfully applied in image segmentation by automatically learning hierarchical features directly from raw images data. Amira™  software offers an integrated Deep Learning environment providing an interface to automatically segment and extract cellular features from microscopy images. Advances in Deep Learning have positioned neural networks as a powerful alternative to traditional approaches such as manual and algorithmic-based segmentation. In particular, the development of the U-Net architecture provided a significant boost to segmentation performance and has now become the template for many modern segmentation models.

We have trained with the Deep Learning Training interface in Amira™ a generic U-Net model using synthetic light microscopy data generated using the SIMCEP simulation tool [Ref. 1]. Using a time series dataset of human breast carcinoma cells [Ref. 2], we applied the U-Net model to predicted the location of the stained cells directly on the raw image data. The prediction results from the pre-trained model on the data set of carcinoma cells were promising. Though this Deep Learning based workflow can be used directly on the raw data it could be part of a fully automated processing pipeline. The combination with the new Smart Multi-channels time-Series system in Amira™  well facilitates the visualization and quantitative analyses of challenging high-resolution data time-series.  


References

[Ref. 1: https://www.cs.tut.fi/sgn/csb/simcep/tool.html].

[Ref. 2: Dr. Kamm. Dept. of Biological Engineering, MIT, MA (USA)]


59 Generalized Statistical Object Distance Analysis (GSODA) For Object Based Colocalization In Quantitative Microscopy

Suvadip Mukherjee1,2, Thibault Lagache1,2, Lydia Danglot3,4, Jean-Christophe Olivo-Marin1,2
1Institut Pasteur. 2CNRS UMR 3691. 3Paris University. 4Inserm U1266

Abstract Text

We propose a novel method to measure statistical colocalization in the paradigm of level set analysis. This solution builds on SODA [1], which is a tool to study colocalization between two (or more) spatial point processes (see Fig. 1(a1)). The proposed technique, namely Generalized SODA (GSODA) extends the applicability of its predecessor to accommodate more generic region based colocalization studies. An example application in digital pathology is illustrated in Fig. 1(a2)-(a3). GSODA provides a fast, generic, and robust model to study colocalization for a variety of problems commonly encountered in fluorescent microscopy, super resolution imaging, and histopathology. In this context, we leverage the flexibility of level sets [2] to implicitly embed closed region boundaries, and develop a mathematical model to analytically estimate the model parameters to describe the colocalization properties of the underlying random process. GSODA preserves the statistical characteristics of SODA, but extends its use to a wider gamut of colocalization studies. Furthermore, by restricting the level set function to the region of interest by using suitable boundary conditions, GSODA eliminates the need to explicitly correct for edge-artifacts, which could be challenging to compute for complex shapes. For applications involving significant spatial clustering of points, the GSODA model could be trivially extended to eliminate the need for non-trivial data unmixing, which makes the proposed solution both robust and computationally efficient. Finally, due to the recent advances in real-time polygon based digital morphology, GSODA allows computationally efficient solution for processing big data in bio-image informatics applications. Preliminary experiments suggest robustness and computational efficiency of GSODA in colocalization studies in biology.


Uncaptioned visual

Fig. 1: Two potential applications of object based colocalization is presented here. The first example (a1) involves estimating protein colocalization in super-resolution microscopy. In (a2), an example is taken from histopathology where the objective is to study the spatial colocalization of the immune cells (points) to the tumor regions (a3).


60 Computational tool for automated study of cell division dynamics in 3D cellular spheroids

Stylianos Didaskalou1, Lito Karkaletsou1, Christos Efstathiou1,2, Avgi Tsolou1, Andreas Girod2, Maria Koffa1
1Department of Molecular Biology and Genetics, Democritus University of Thrace, Alexandroupolis, Greece. 2Department of Life Sciences and Medicine, University of Luxembourg, Esch-sur-Alzette, Luxembourg

Abstract Text

Recent studies focus on three-dimensional cell cultures that  more accurately mimic the environment of a  tumor in vivo, compared to two-dimensional (monolayer) cell cultures. Light Sheet Fluorescence Microscopy (LSFM) is the gold standard for  three-dimensional imaging of multicellular spheroids, providing both high spatial and temporal resolution, while maintaining low  phototoxicity and photobleaching  levels.   Although LSFM microscopes are widely utilized  for  live imaging of such  thick samples with subcellular resolution, the enormous amount of data generated makes manual analysis of 4D data (3D+t) challenging. To this end , we aimed to develop a pipeline in order  to automatically analyze the temporal dynamics of cells divisions inside 3D multicellular spheroids.  

In a multicellular spheroid, cells proliferate in close proximity, thus better mimicking  cell-cell interactions, such as physical communication and signaling pathways. Moreover, the 3D geometry of spheroids restricts the flow of growth nutrients and oxygen towards the inner layers, forming proliferation gradients commonly found in tumors1. Recent studies demonstrate  that nuclei inside cleared cellular spheroids are  elongated, with the longest axis  preferentially parallel to the spheroid’s surface2. Moreover , live imaging of spheroids shows a preference in the  orientation of the mitotic spindle, with its division axis almost parallel to the surface. However, the aforementioned analysis requires manual nuclei segmentation. For this reason, our study aims to automate nuclei segmentation, cell cycle phase classification and cell tracking, in order to study cell division dynamics in the interior of  3D multicellular spheroids.

In our preliminary experiments, HeLa Kyoto cells stably expressing mCherry-H2B were grown as multicellular spheroids with an approximate diameter of  150μm. Spheroids were embedded in low melting- agarose and imaged with a light sheet fluorescence microscope (LaVision Biotech, Bielefeld / Germany). In order to segment individual nuclei of different sizes, a scale-space Laplacian of the Gaussian blob detector  was  used to identify seed points, followed by an immersed watershed segmentation to separate adjacent cells in the initial segmented binary image3,4.

Analysis, of n=1090 nuclei derived from N =6 spheroids, showed that nuclei are elongated with an aspect ratio of (mean ± S.D) between long and short axis (Figure 1A). Additionally, using morphological operations and alpha shape to approximate spheroid surface, we were able to analyze the orientation of nuclei long axis  compared to the spheroid surface. The analysis showed nuclei elongation preferentially in parallel to the surface (Figure 1B). 

To further classify cells according to their cell cycle phase, a convolution neural network is used. As training a neural network requires user-annotated data, an application to simplify the process has already been developed . With this application, the user has the ability to  label the already segmented nuclei according to the cell cycle phase. Finally, cells can be tracked in time, providing the opportunity to extract useful temporal information.

Advances in both fluorescence microscopy and three-dimensional cell culture methods enable us to fill  the gap between 2D cell cultures and real tissues. However, the tremendous amount of generated data imposes the need for development of  computational pipelines and tools for the automatic and robust analysis of high dimensionality images. This will help us study the spatiotemporal dynamics of cell division, in 3D tumor models with greater accuracy and precision.


Uncaptioned visual

Figure 1. A) Aspect ratio between long and middle axis (L1/L2) and long and short axis (L1/L3) of automatic segmented nuclei. B) Angle between long axis of nuclei and the normal to the surface. The normal to the surface is being computed to the surface closest point from each nucleus centroid. 


References

1.           Pampaloni, F., Ansari, N. & Stelzer, E. H. K. High-resolution deep imaging of live cellular spheroids with light-sheet-based fluorescence microscopy. Cell Tissue Res. 352, 161–177 (2013).

2.           Desmaison, A. et al. Impact of physical confinement on nuclei geometry and cell division dynamics in 3D spheroids. Sci. Rep. 8, 1–8 (2018).

3.           Stegmaier, J. et al. Fast segmentation of stained nuclei in terabyte-scale, time resolved 3D microscopy image stacks. PLoS One 9, 1–11 (2014).

4.            Schmitz, A., Fischer, S. C., Mattheyer, C., Pampaloni, F. & Stelzer, E. H. K. Multiscale image  analysis reveals structural heterogeneity of the cell microenvironment in homotypic spheroids. Sci. Rep. 7, 43693 (2017).


64 Scalable strategies for interoperable bioimaging data

Josh Moore
Open Microscopy Environment (OME)

Abstract Text

Despite significant advances in biological imaging and analysis, major informatics challenges remain unsolved: file formats are proprietary, storage and analysis facilities are lacking, as are standards for sharing image data and results. 

The Open Microscopy Environment (OME) is an open-source software project that develops tools to enable access, analysis, visualization, sharing and publication of biological image data. OME supports more than 150 image data formats across many imaging modalities including fluorescence microscopy, high-content screening, whole-slide imaging and biomedical imaging.

OME releases specifications and software for managing image datasets and integrating them with other scientific data. OME’s Bio-Formats is a file translator that enables scientists to open and work with imaging data in the software application of their choice. OMERO is an image database application that provides data management and sharing capabilities to imaging scientists. Bio-Formats and OMERO are used in 1000’s of labs worldwide to enable discovery with imaging.

Additionally, we have used Bio-Formats and OMERO to build a system for publishing imaging data associated with peer-reviewed publications. The Image Data Resource (IDR) has published >80 studies and >260TB of imaging data annotated with >19,000 genes and 31,000 small molecules inhibitors and drugs. IDR includes a cloud-based analysis portal to catalyse the re-use and re-analysis of published imaging data.

Despite these efforts, there are still inherent limits in existing research infrastructure available for tackling the next scale of bioimaging: the cloud. As a result, OME in collaboration with collaborators and the community have begun defining a next-generation file format (OME-NGFF) to address these next challenges.

This poster explores  lessons learned over nearly two decades of supporting bioimaging scientists and their data formats, discusses our existing open file formats as well as those under development, and proposes strategies for the exchange of imaging data publishing and re-analyzing images.

References

Josh Moore, Chris Allan, Sebastien Besson, Jean-Marie Burel, Erin Diel, David Gault, Kevin Kozlowski, Dominik Lindner, Melissa Linkert, Trevor Manz, Will Moore, Constantin Pape, Christian Tischer, Jason R. Swedlow (2021) OME-NGFF: scalable format strategies for interoperable bioimaging data. bioRxiv 2021.03.31.437929; doi: https://doi.org/10.1101/2021.03.31.437929

Eleanor Williams, Josh Moore, Simon W. Li, Gabriella Rustici, Aleksandra Tarkowska, Anatole Chessel, Simone Leo, Bálint Antal, Richard K. Ferguson, Ugis Sarkans, Alvis Brazma, Rafael E. Carazo Salas, Jason R. Swedlow (2017) The Image Data Resource: A Bioimage Data Integration and Publication Platform. Nature Methods 14(8), 775-781. Published 19 June 2017 doi: https://doi.org/10.1038/nmeth.4326

Chris Allan, Jean-Marie Burel, Josh Moore, Colin Blackburn, Melissa Linkert, Scott Loynton, Donald MacDonald, William J Moore, Carlos Neves, Andrew Patterson, Michael Porter, Aleksandra Tarkowska, Brian Loranger, Jerome Avondo, Ingvar Lagerstedt, Luca Lianas, Simone Leo, Katherine Hands, Ron T Hay, Ardan Patwardhan, Christoph Best, Gerard J Kleywegt, Gianluigi Zanetti & Jason R Swedlow (2012) OMERO: flexible, model-driven data management for experimental biology. Nature Methods 9, 245–253. Published: 28 February 2012 doi: https://doi.org/10.1038/nmeth.1896

Melissa Linkert, Curtis T. Rueden, Chris Allan, Jean-Marie Burel, Will Moore, Andrew Patterson, Brian Loranger, Josh Moore, Carlos Neves, Donald MacDonald, Aleksandra Tarkowska, Caitlin Sticco, Emma Hill, Mike Rossner, Kevin W. Eliceiri, and Jason R. Swedlow (2010) Metadata matters: access to image data in the real world. The Journal of Cell Biology 189(5), 777-782. doi: https://doi.org/10.1083/jcb.201004104


71 Quality control of image sensors using Gaseous Tritium Light Sources

David McFadden1,2,3, Brad Amos4, Rainer Heintzmann2,1,3
1Institute of Physical Chemistry and Abbe Center of Photonics, Friedrich-Schiller-University, Jena, Germany. 2Leibniz Institute of Photonic Technology, Albert-Einstein-Straße 9, 07745 Jena, Germany. 3Jena Center for Soft Matter (JCSM), Friedrich Schiller University Jena, Jena, Germany. 4Medical Research Council, MRC, Laboratory of Molecular Biology, Cambridge, United Kingdom

Abstract Text

Summary

We propose a practical method for quality control of cameras using inexpensive tritium radioluminescent tubes (betalights). The mechanical design is easily reproducible and can be 3D-printed. Suitable for both EMCCD and sCMOS cameras, this method has the potential to be a useful tool in microscopy facilities and optical labs alike.

Introduction

Cameras and other detectors may show signs of damage or ageing which can affect the quality and reproducibility of data. Despite this, many labs do not regularly perform quantitative quality control checks on their instruments.[1]

One explanation could be a relative lack of convenient and low-cost calibration sources. Measuring the gain and noise characteristics of a detector requires a stable light source. In order to measure the quantum efficiency, the light source must furthermore be calibrated to a radiometric standard. Alternatively, one could perform a control experiment using a calibrated detector, but this adds complexity to the procedure. While commercial solutions are available, they tend to be expensive, bulky and the calibration process itself can be laborious.

Methods

Gaseous Tritium Light Sources (GTLSs, or betalights), used in niche products such as high-end watches, gun sights or fishing tackle, are relatively inexpensive (approximate cost 10-20 EUR) and emit a stable and predictable light over long periods of time, ideally suited as a standard light source. The idea of using radioluminescent light sources as a low-light radiometric standard is not new [2,3]. But while GTLS-based sensor quality-control has been carried out by astronomical observatories [4], radioluminescence based calibration methods have not to our knowledge been widely adopted in microscopy facilities.

It is possible to characterize the radiant power of such a source using a common photodiode power meter. Combining this with the spectral power distribution measured using a spectrometer, we can calculate an expected photon flux.

We designed and 3D printed a mount for a small GTLS tube (Fig. 1). The apertures are specifically dimensioned such that the light beam under-fills the detector. There are no optical elements between the source and the camera.

The mounted source is screwed onto the camera lens mount, and a stack of images at constant exposure is acquired (Fig. 2). Afterwards, the source is replaced with a camera body cap and we acquire a stack of dark background images.

Uncaptioned visualUncaptioned visual

Figure 1: Left: View of the assembled source. Right: Cross-section showing the mounted light source attached to a camera. The divergent light beam (NA approximately 0.1) impinges upon the image sensor.

Uncaptioned visual

Figure 2: An acquired image frame. The beam under-fills the image sensor. As this is also true when it is used with the calibrated photodiode, the total photon fluxes are equivalent. The feathered edges of the beam spot provide a broad range of intensities, which is useful for generating photon transfer curves in the analysis step.

Results

Using conventional analysis routines [5,6], we quantify the gain and read noise of the detector. As the calibrated source emits photons at a known rate, we can gauge the quantum efficiency of the detector. We thus tested both an EMCCD and sCMOS camera and were able to confirm the manufacturer-quoted quantum efficiencies to within 3 percent.

Uncaptioned visual

Figure 3: A photon transfer curve obtained from a stack of images acquired by an sCMOS camera. The dots represent bins of pixels with similar brightness. The gain is estimated via the slope of a linear fit (dashed line) and this, in turn, allows us to express the signal in units of physical photoelectrons (top and right secondary axes). 

Conclusion

We demonstrated a reproducible tool and method for gauging the performance characteristics of cameras. The intensity is suitable for calibrating detectors at very low light levels, characteristic especially of single-molecule-localisation microscopy.

The source is compact, can be attached in situ, and does not require an external power supply or any additional instrumentation. Another major advantage of the design is that the calibration allows for a plug and play approach with automatic image analysis.

Additionally, it is extremely low-cost and the mechanical parts can easily be manufactured using a 3D printer. We believe that it could therefore be a useful tool in microscopy facilities and optical labs.

References

1. Nelson, G. et al. QUAREP-LiMi: A community-driven initiative to establish guidelines for quality assessment and reproducibility for instruments and images in light microscopy. arXiv.org https://arxiv.org/abs/2101.09153 (2021).

2. W. Hanle & I. Kügler (1956) Radiolumineszenz als Lichtquelle Konstanter Intensität, Optica Acta: International Journal of Optics, 3:3, 131-138, DOI: 10.1080/713823667

3. Yamamoto, Osamu, Mutsuo Takenaga, and Yoshinobu Tsujimoto. Standard light source utilizing spontaneous radiation. US patent US3889124A, filed June 21, 1973.

4. Amico P. et al. (2008) The Detector Monitoring Project. In: Kaufer A., Kerber F. (eds) The 2007 ESO Instrument Calibration Workshop. ESO Astrophysics Symposia European Southern Observatory. Springer, Berlin, Heidelberg. https://doi.org/10.1007/978-3-540-76963-7_2

5. L.J. van Vliet, D. Sudar, and I.T. Young. Cell Biology, volume III, chapter Digital Fluorescence Imaging Using Cooled CCD Array Cameras, pages 109-120. Academic Press, New York, 2nd edition, 1998

6. Lidke, K. A., Rieger, B., Lidke, D. S. & Jovin, T. M. The role of photon statistics in fluorescence anisotropy imaging. IEEE Trans. on Image Process. 14, 1237–1245 (2005).


73 The Image Data Resource: a scalable resource for FAIR biological imaging data

Frances Wong1, Sebastien Besson1, Jean-Marie Burel1, Dominik Lindner1, Josh Moore1, Will Moore1, Petr Walczysko1, Ugis Sarkans2, Alvis Brazma2, Jason Swedlow1
1Division of Computational Biology, University of Dundee, Dundee, United Kingdom. 2EMBL-EBI, Wellcome Trust Genome Campus, Hinxton, United Kingdom

Abstract Text

Access to primary research data is fundamental for the advancement of science. Much of the published research in the life sciences is based on image datasets that sample 3D space, time, and the spectral characteristics of detected signal to provide quantitative measures of cell, tissue and organismal processes and structures. However, the sheer size and heterogeneity of original image data sets– multi-dimensional image stacks combined with experimental metadata and analytic results– makes image data handling and publication extremely complex and, in practice, rarely achieved.


To address this challenge, we have built a next-generation imaging database, the Image Data Resource (IDR; http://idr.openmicroscopy.org). IDR is an added-value resource that combines and integrates data from multiple independent imaging experiments and from many different imaging modalities, into a single public resource. IDR supports browsing, search, visualisation and computational processing within and across datasets acquired from a wide variety of imaging domains. IDR stores, publishes and integrates >260 TB of super-resolution, high content screening, timelapse and histological whole slide imaging data with metadata related to experimental design, image acquisition, downstream analysis and interpretation. Data from >85 studies are available for search and query through a user-friendly web interface, with links from imaging data to reagents, methods and phenotypes via published ontologies. Cloud-based re-analysis of IDR data is enabled using JupyterHub. Reference image data submitted to IDR is also published in EMBL-EBI’s BioImage Archive, assuring sustainability and long-term data availability.


We will show recent updates to the IDR including separation between domains of image data, new cloud-optimised file formats for reading large datasets, and the appearance of a new national level for independent federated IDRs.


75 Icy 2: The newly redesigned software for bioimage analysis

Stephane Dallongevlle, Daniel Fernandez Obando, Marion Louveaux, Jean-Christophe Olivo Marin
Institut Pasteur

Abstract Text

We present Icy 2 (http://icy.bioimageanalysis.org), which is a major evolution of our previous free and open software for bioimage analysis Icy1. This new version brings the ability to handle larges images which does not fit into the system memory using an adaptive caching engine, thus allowing both visualization and processing of big dataset transparently for users and developers. Along this Icy 2 comes with a totally redesigned web site for improved interactions within the Icy community. The project foundations were strengthened by the use of Maven, providing much more robust development processes for developers and ensuring a better perinity for the project in a whole.

Icy 2 has retained and consolidated the major features that made its success in the bioimaging community, namely to make it available to the bioimaging community an image analysis software suite that encompasses the large variety of biological applications (microscopy analyst, physicist, developer) and to give access to advanced image analysis solutions (particle tracking, HCS/HTS, digital pathology, animal behavior,…) to users. 

Uncaptioned visualSince its launching, it has been the constant philosophy of the Icy team to promote sharing of source code and know-how and to facilitate the use of quantitative approaches and open new scientific perspectives in terms of exhaustiveness, reproducibility and robustness of the analysis of bioimaging data sets. For those reasons, Icy 2 with its newly redesigned website includes new communication channels between the end-users and the developers, new tutorial materials and improved maintenance cycles. Icy 2 now provides more than 400 dedicated plugins covering a large variety of state-of-the-art image analysis methods ranging from active contours models to Machine Learning through statistical spatial analysis, which empowers users with the most recent and adapted quantitative image analysis and visualization tools. Protocols, which are a graphical front-end that enable software development without any programming knowledge, have also been improved and now include the possibility to develop sophisticated image processing pipelines in a more readable and interactive manner.

Icy 2 has a large community of developers and users (4000+ regular users, 700+ students trained, 1500+ visits per month). For its long-term sustainability and development, the Icy 2 project benefits from the institutional support of the French national Infrastructure France Bio Imaging and of Institut Pasteur. Ongoing work aims at improving the interoperability and convergence of Icy 2 with other open and free image analysis packages as well as facilitating the integration and use of AI packages.


References

de Chaumont, F. et al. (2012)
Icy: an open bioimage informatics platform for extended reproducible research, Nature Methods, 9, pp. 690-696


84 BIAFLOWS: A collaborative framework to reproducibly deploy and benchmark bioimage analysis workflows

Ulysse Rubens1, Romain Mormont1, Lassi Paavolainen2, Volker Bäcker3, Benjamin Pavie4, Leandro A. Scholz5, Gino Michiels6, Martin Maška7, Devrim Ünay8, Graeme Ball9, Renaud Hoyoux10, Rémy Vandaele1, Ofra Golani11, Stefan G. Stanciu12, Natasa Sladoje13, Perrine Paul-Gilloteaux14, Raphaël Marée1, Sébastien Tosi15
1University of Liège. 2FIMM, HiLIFE, University of Helsinki. 3MRI, BioCampus Montpellier. 4VIB BioImaging Core. 5Universidade Federal do Paraná. 6HEPL, University of Liège. 7Masaryk University. 8Faculty of Engineering İzmir, Demokrasi University. 9Dundee Imaging Facility, School of Life Sciences, University of Dundee. 10Cytomine SCRL FS. 11Life Sciences Core Facilities, Weizmann Institute of Science. 12Politehnica Bucarest. 13Uppsala University. 14Structure Fédérative de Recherche François Bonamy, Université de Nantes, CNRS, INSERM. 15Institute for Research in Biomedicine, IRB Barcelona, Barcelona Institute of Science and Technology, BIST

Abstract Text

Image analysis has become a ubiquitous tool for research in biology and efficient algorithms addressing important problems such as automated cell segmentation and nuclei tracking are now often published as the main outputs of scientific articles. As more options are available to the end users, picking the right image analysis method is becoming increasingly daunting. Furthermore, state of the art methods are still sometimes released as source code requiring specific software environments and complex procedures to run, making reproducing results sometimes a project of its own. Finally, comparing methods by simple visual inspection is biased by nature while quantitatively comparing methods across platforms is time consuming as it typically requires to re-implement the same evaluation framework in each environment or to deal with different data formats.

BIAFLOWS (Rubens et al., Cell Patterns, 2020) is an open-source web platform extending Cytomine (Marée et al., Bioinformatics, 2016) that has been developed to overcome all these challenges by defining standard data formats for a broad range of bioimage problems and by storing image datasets, image analysis workflows and associated functional parameters in the same platform. Once integrated to BIAFLOWS, workflows written in any programming language or targeting any existing bioimage analysis software can be run remotely on all the images of a dataset stored in the system, and all the results can be co-visualized through a user-friendly web interface. Additionally, when ground truth annotations are available, a set of problem dependent benchmark metrics assessing the accuracy of the workflows is automatically computed and available as consolidated statistics. All data is stored in unified databases and can be easily explored and shared through the web for effective collaboration and to ensure reproducibility.

A curated instance of BIAFLOWS with a strong focus on multidimensional microscopy bioimages is publicly accessible1 and, as a community effort2, is being populated with reference multidimensional scientific image datasets (2D, 3D, 2D+t, 3D+t,...) and associated image analysis workflows using computer vision or deep learning algorithms   (currently over 40 workflows, targeting for instance ImageJ, Icy, Ilastik, CellProfiler, Python, Keras/Tensorflow,...). The datasets and workflows are selected to recapitulate important bioimage analysis problems organized as nine problem classes (object segmentation, pixel classification, object counting, object detection, filament tree tracing, filament networks tracing, landmark detection, particle tracking, object tracking), each with its own set of associated benchmark metrics. 

New image analysis workflows can be versioned and added through a framework3 leveraging online managed web services and the source code of all the workflows is publicly available through the system. For this purpose, a sandbox server4 is available to test the integration of new workflows or to test existing workflows on user uploaded images. Finally, besides being a public platform for continuous benchmarking, BIAFLOWS can also be installed as a local solution for image management and analysis into which existing workflows can easily be imported.

References

Rubens U, Mormont R, [...], Tosi S. BIAFLOWS: A Collaborative Framework to Reproducibly Deploy and Benchmark Bioimage Analysis Workflows, Patterns (Cell Press) 1(3): 100040. 2020.

Marée, R., Rollus, L., Stévens, B., Hoyoux, R., Louppe, G., Vandaele, R., Begon, J.M., Kainz, P., Geurts, P., and Wehenkel, L. (2016). Collaborative analysis of multi-gigapixel imaging data with Cytomine. Bioinformatics 32, 1395–1401.


91 Global BioImaging Training Resource

Gleb Grebnev
EMBL

Abstract Text

Global BioImaging is an international network of imaging infrastructures and communities which was initiated in 2015. Global BioImaging pursues a number of key activities including international cooperation to propose solutions to the challenges faced by the imaging community globally, build a strong case towards the funders that imaging technologies and research infrastructures are key in the advancement of life sciences, and to build capacity internationally. One of its arms is its Training Program which includes training courses in facility management and image data. In an effort to expand its reach within training, Global BioImaging has developed a platform that allows to create training modules within categories that are dedicated to a single overarching topic (e.g. image data, core facility management, imaging technologies). This Training Resource, now live, can be accessed on Global BioImaging website (https://globalbioimaging.org/) under the Training menu.

This platform provides a simple way to create thematic modules consisting of training content that is located at different locations online. Each of the modules, in addition to a module title and description, can consist of four types of entries: 1) custom text, 2) video, 3) PDF, and 4) external link. Custom text can be used for multiple purposes including topic description, further reading including embedding of links in a text, and acknowledgements of where the training material came for, presenters of talks, instructors or trainers of workshops, and their affiliations. Video, although not stored on Global BioImaging website, is displayed via a video player that fetches the video from YouTube. This is particularly useful feature given the fact that many imaging core facilities, imaging networks and infrastructures, now have their own YouTube channels with excellent content. That content, however, is scatted across different channels and more often than not does not provide training within an entire topic due to complexity and difficulty associated with many topics. External links can be used in many instances such as redirecting users of the training resource to web-pages of software, supplementary information, and external free of charge courses that supplement the training material in the module.

The key to producing an excellent module is undoubtedly curation and vetting of the training material that is part of a module. In addition to the four types of entries, difficulty rating (beginner, intermediate, advanced, or unassigned), target audience (core facility user, core facility staff, or both), and estimated time of completion accompany module title and description. These indicators serve a useful purpose that guide a user of the training resource in deciding whether to commit to a particular module. Global BioImaging invites contributions to the Training Resource from interested members of imaging community. A number of curated modules in different categories are already available demonstrating the wide variety of potential content and how individual modules can be structured.

References


72 Organelle topology is a new breast cancer cell classifier

Ling Wang1, Joshua Goldwag1, Megan Bouyea1, Jamie Ward1, Niva Maharjan2, Amina Eladdadi2, Margarida Barroso1
1Albany Medical College. 2The College of Saint Rose

Abstract Text

Breast cancer is a highly heterogeneous disease, both phenotypically and genetically. The spatial organization of organelles is closely linked to their biological functions, yet our understanding of higher order intracellular organization is incomplete. Here, we sought to classify breast cancer cell lines based on the spatial context of organelles within cells, specifically their subcellular location and topological inter-organelle relationships. We have introduced a novel approach that quantifies, for the first time, the topological features of subcellular organelles, removing the bias of visual interpretation, to classify different breast cancer cell lines. This method was tested on three different organelle datasets: mitochondria (Mito), early endosomes (EEC) and endosome recycling compartment (ERC) in a panel of human breast cancer cells, and non-cancerous mammary epithelial cells. A morphometric evaluation of EEC, ERC and Mito resulted in 34 topology and morphology parameters. Application of Random Forest machine learning (ML) to 18 of these 34 parameters generated the highest accuracy in breast cancer cell classification. We systematically evaluated how different parameter combinations affected the machine learning-based cancer cell classification and discovered that topology parameters were crucial to achieve a classification accuracy over 95% of human breast cancer cell lines of differing subtype and aggressiveness. These findings lay the groundwork for using quantitative topological organelle features as an effective method to analyze and classify breast cancer cell phenotypes.

Organelle compartments as the cellular proteome are highly regulated in a spatiotemporally manner. However, advanced understanding on the cellular distribution of a network of organelle compartments, i.e. organelle topology, is lacking.  Here, we present OTCCP (Organelle Topology-based Cell Classification Pipeline), using ML-based method for the classification of breast cancer cell lines. To overcome the above limitations and lay the foundation for future cell recognition and diagnostics based on single cell analysis, OTCCP encompasses three major steps: (1) images were obtained by Airyscan high resolution microscopy at subcellular level and 3D rendered; (2) topology features for hundreds of organelle objects per cell were calculated; and (3) cell classification based on topology features was carried using ML algorithm. OTCCP was applied to three common organelles EEC using anti-EEA1 immunostaining, ERC using fluorescently labeled transferrin and Mito using anti-TOM20 immunostaining among six breast cancer cell lines MCF10A, AU565, MDA-MB-231 (MDA231), MDA-MB-436 (MDA436), MDA-MB-468 (MDA468), AU565 and T47D. These three different organelle topology datasets were tested using the same algorithm pipeline, outperforming topology and morphology-based methods. Based on the spatial distribution of organelles, i.e. distance from neighbor organelles (topology), a ML-based classification accuracy over 95% was achieved to discriminate between several human breast cancer cell lines of differing subtype and aggressiveness. 


Here, we have defined organelle networks by their organelle topology, i.e. the connectivity and spatial distribution as determined using the distance between each organelle object and all of its neighbors. OTCCP obtained the highest classification accuracy for organelle datasets using NDPG: 92.4% (Mito), 95.9% (ERC), and 97.1% (EEC). Using all 34 parameters (ONDPG), OTCCP displayed reduced classification accuracy at 90.7% (Mito), 94.0% (ERC), and 95.8% (EEC). OTCCP obtained the lowest classification accuracy 51.7% (Mito), 57.1% (ERC), and 60.8% (EEC) using OPG. From highest to lowest, classification accuracy ranking is: NDPG > ONDPG > DPG > ODPG > ONPG > NPG > OPG. Among the three organelles, when 7 different parameter groups were used in the classification tasks, EEC datasets always showed the highest classification accuracy comparing to the other two organelle datasets. Mito datasets always showed the lowest accuracy.


We confirmed the importance of cellular and nuclear morphology in breast cancer cells heterogeneity in using OTCCP. Furthermore, we demonstrated that organelle topology is more important than organelle and cell morphology in the classification of breast cancer cells. Importantly, three different organelle network datasets show consistent results in their ability to classify different breast cancer lines with high accuracy. These results suggest that EEC due to their puncta nature are ideal for cell classification. We also found that positioning of endosomes and distance between endosome objects across the cell is established for each cell in a regulated manner. Thus, reinforcing our principle that organelle’s spatial distribution (topology) plays a key role in breast cancer cell classification. This notion was also confirmed by the importance index ranking, in which topology-based parameters are dominant in the top 10 parameters. These findings lay the groundwork for using organelle profiling as a potentially fast and efficient method for phenotyping breast cancer function as well as identifying other cell types and conditions.

Uncaptioned visual

Figure 1. Visual descriptions of different groups and their specific parameters. The pink dot represents the origin of the cell, which is the geometric center of nucleus, the blue dots represent the geometric center of each 3D rendered object. Object-based group (OPG), nucleus-related group (NPG), and distance-related group (DPG) includes 16, 6 and 12 different parameters respectively. 


Uncaptioned visual

Figure 2. Machine learning classification comparison using cellular and subcellular morphological parameters in breast cancer cells.

A. Each cell line’s 3D rendered organelle object number. The purple line shows the mean of each organelle’s object number through 6 cell lines per cell, EEC mean = 215, EEC mean = 325, Mito mean = 76. 

B. Classification accuracy by Random Forest algorithm using different parameter groups at cellular level (The black bar shows the accuracy greater than 90%, the gray bar shows the accuracy smaller than 90%, same as Fig. 2C).

C. Classification accuracy by the Random Forest algorithm using different parameter groups at subcellular level in 3 organelle datasets including EEC, ERC and Mito. 


References

Zardavas, D., Irrthum, A., Swanton, C. & Piccart, M. Clinical management of breast cancer heterogeneity. Nature Reviews Clinical Oncology (2015) doi:10.1038/nrclinonc.2015.73.

Thul, P. J. et al. A subcellular map of the human proteome. Science (80-. ). (2017) doi:10.1126/science.aal3321.

Chang, A. Y. & Marshall, W. F. Organelles – understanding noise and heterogeneity in cell biology at an intermediate scale. J. Cell Sci. 130, 819–826 (2017).

Warren, A. et al. Global computational alignment of tumor and cell line transcriptional profiles. Nat. Commun. 12, 1–12 (2021).

Valm, A. M. et al. Applying systems-level spectral imaging and analysis to reveal the organelle interactome. Nature (2017) doi:10.1038/nature22369.

Collinet, C. et al. Systems survey of endocytosis by multiparametric image analysis. Nature 464, 243–249 (2010).

Zahedi, A. et al. Deep Analysis of Mitochondria and Cell Health Using Machine Learning. Sci. Rep. 8, 1–15 (2018).


78 Leveraging the Adaptive Particle Representation for efficient large-scale neurohistology

Jules Scholler1, Joel Jonsson2,3,4,5, Tomàs Jordà-Siquier6, Jorge Barros1, Laura Batti1, Bevan L. Cheeseman2,3,4, Stephane Pagès1, Christophe M. Lamy6, Ivo F. Sbalzarini2,3,4,5
1The Wyss Center for Bio and Neuroengineering, Geneva, Switzerland. 2Technische Universität Dresden, Faculty of Computer Science, 01069 Dresden, Germany. 3Max Planck Institute of Molecular Cell Biology and Genetics, 01307 Dresden, Germany. 4Center for Systems Biology Dresden, 01307 Dresden, Germany. 5Center for Scalable Data Analytics and Artificial Intelligence ScaDS.AI, Dresden/Leipzig, Germany. 6Division of Anatomy, Faculty of Medicine, University of Geneva, Geneva, Switzerland

Abstract Text

The abstract content is not included at the request of the author.

References

[1] B. L. Cheeseman, U. Günther, K. Gonciarz, M. Susik, and I. F. Sbalzarini, “Adaptive particle representation of fluorescence microscopy images,” Nature Communications, vol. 9, no. 1, Dec. 2018.

[2] A tool for fast automatic 3D-stitching of teravoxel-sized microscopy images (BMC Bioinformatics 2012, 13:316)

[3] S. Berg et al., “ilastik: interactive machine learning for (bio)image analysis,” Nature Methods, vol. 16, no. 12, pp. 1226–1232, Dec. 2019.

[4] Niedworok, C.J., Brown, A.P.Y., Jorge Cardoso, M., Osten, P., Ourselin, S., Modat, M. and Margrie, T.W., (2016). AMAP is a validated pipeline for registration and segmentation of high-resolution mouse brain data. Nature Communications. 7, 1–9.

[5] Tyson, A.L., Rousseau, C.V., and Margrie, T.W. (2021). brainreg: automated 3D brain registration with support for multiple species and atlases.


13 Correction of multiple-blinking artefacts in photoactivated localisation microscopy

Louis Jensen1, Tjun Yee Hoh2, David Williamson3, Juliette Griffie4, Daniel Sage4, Patrick Rubin-Delanchy2, Dylan Owen5
1Aarhus University. 2University of Bristol. 3King's College London. 4EPFL. 5University of Birmingham

Abstract Text

Photoactivated localisation microscopy (PALM) produces an array of localisation coordinates by means of photoactivatable fluorescent proteins. However, observations are subject to fluorophore multiple-blinking and each protein is included in the dataset an unknown number of times at different positions, due to localisation error. This causes artificial clustering to be observed in the data. We present a workflow using calibration-free estimation of blinking dynamics and model-based clustering, to produce a corrected set of localisation coordinates now representing the true underlying fluorophore locations with enhanced localisation precision. These can be reliably tested for spatial randomness or analysed by other clustering approaches, and previously inestimable descriptors such as the absolute number of fluorophores per cluster are now quantifiable, which we validate with simulated data. Using experimental data, we confirm that the adaptor protein, LAT, is clustered at the T cell immunological synapse, with its nanoscale clustering properties depending on location and intracellular phosphorylatable tyrosine residues.


16 Euro-BioImaging Industry Board - Fostering Collaboration between the imaging industries and research infrastructures

Claudia Pfander
Euro-BioImaging. EMBL Heidelberg

Abstract Text

Euro-BioImaging ERIC as the pan-European Research Infrastructure for Imaging Technologies in Biological and Biomedical Science provides user access to more than 45 different high-end imaging technologies as well as to FAIR image data repositories and analysis tools.

Imaging is a rapidly evolving field in which new technological developments, new applications and advances in image data analysis based on AI have the potential to revolutionize European research in many disciplines from Health to Environmental Science. For a long time, the imaging industry has recognized the importance of providing coordinated open access to expert imaging platforms to the scientific community and has supported Euro-BioImaging from its early preparatory phase. 

The Euro-BioImaging Industry Board (EBIB) has been set up in 2014 as an independent body to drive the close exchange between companies, imaging facilities and infrastructure users on emerging technological trends and user needs. EBIB aims to support technological co-development testing of new instruments and technologies to boost innovation and strengthen the companies’ position on the market, while ensuring a high level of expertise and competitiveness at the Euro-BioImaging Nodes for the delivery of services through training and knowledge exchange.

Furthermore, the EBIB provides an industry perspective to the strategic planning of Euro-BioImaging and helps raise the profile of the imaging sector with policy makers and funders. 


18 Up-grading a confocal microscope into a super-resolution microscope using an array detector

Monalisa Goswami1,2, Renè Richter1, Rainer Heintzmann1,3
1Leibniz Institute of Photonic Technology, Jena, Germany. 2Institute of Physical Chemistry, Friedrich-Schiller-University Jena, Germany. 3Institute of Physical Chemistry, Abbe Center of Photonics, Friedrich-Schiller-University Jena, Germany

Abstract Text

Laser scanning confocal microscopes (LSCM) are more popular for their sectioning capability rather than for an improved resolution. The improvement in resolution, the point spread function width typically reduced as compared to widefield, is only possible when the pinhole is closed. But a closed pinhole will drastically reduce the SNR. This problem is overcome by using image scanning microscopy (ISM)1. Image scanning microscopy (ISM) is an upgrade of laser scanning confocal microscope (LSCM) where single point detectors like PMTs are replaced by an array detector such as a camera or a SPAD array and the pinhole is kept open to record all available fluorescence2


. But upgrading an existing scanning microscope to ISM is not straightforward. Cameras are usually slow as compared to the scan speed of galvanometric mirrors, hence proper synchronization between the two is a major challenge.

In this study, we make use of the Arduino Due to control both, speed and amplitude of the scan mirrors of an existing confocal microscope (Olympus FluoView). The scanners were provided with the linear ramp voltage synchronized with the frame rate using the two DAC (digital to analog converter) pins of the Arduino Due. The amplitude of this ramp voltage determines the field of view in the sample plane and is controlled by a voltage range shifter circuit.

The system was calibrated using an Argolight calibration slide. Apart from the slight offset in pixel pitch, the system worked as expected. The first data we took was point spread function measurements using sub-nanometer size fluorescent beads. It took roughly two minutes to finish a scan size of 512×512. As can be seen from the figure below, the FWHM in the case of ISM is 157nm which is 1.29 times better than the measured full width at half maximum (FWHM) of 203 nm observed in the case of open pinhole confocal (summed) image.

Uncaptioned visual


References

1C.J.R. Sheppard, "Super-resolution in confocal imaging," Optik 80, 53-54 (1988)


23 Low-cost, sustainable, modular open microscopy and high content analysis

Sunil Kumar1,2, Jonathan Lightley1, Frederik Görlitz1, Ranjan Kalita1, Arinbjorn Kolbeinsson1, Edwin Garcia1, Yuriy Alexandrov1, Simon Johnson1, Martin Kehoe1, Vicky Bousgouni3, Riccardo Wysoczanski1,4, Dan Marks1, Iain McNeish1, Peter Barnes1,4, Louise Donelly1,4, Chris Bakal3, Callum Hollick5, Jeremy Graham5, Christopher Dunsby1,2, Mark Neil1,2, Seth Flaxman1, Paul French1,2
1Imperial College London. 2Francis Crick Institute. 3Institute of Cancer Research. 4National Heart and Lung Institute. 5Cairn Research Ltd

Abstract Text


Summary

We present a low-cost open source microscopy platform that can be configured for a wide range of microscopy modalities. The modular, open source approach based on the modular openFrame microscope stand, enables straightforward maintenance and upgrading of functionality. Here we report exemplar implementations of super-resolved high content analysis (HCA) utilising automated multiwell plate easySTORM implemented with a low-cost multimode diode lasers, a robust optical autofocus module and a new class of low-cost, cooled CMOS camera. 


Introduction

Advanced fluorescence microscopy techniques add value to life sciences research and biomedical applications including super-resolution microscopy (SRM), quantitative phase contrast imaging, hyperspectral imaging. While SRM techniques, in particular, have transformed expectations for cell microscopy, commercial SRM instruments can be unaffordable for many researchers. We have been developing a range of self-built microscopes, including STED and dSTORM instruments and automated microscopes for high content analysis (HCA). Having worked to adapt legacy commercial microscope frames to new modalities, we realised that commercial microscope frames already present a significant cost to lower resource settings and proprietary hardware and software can add challenges to such self-build projects. Accordingly, we have developed a new, modular open source microscope frame, “openFrame”, that aims to minimise cost and to simplify the set-up of self-built advanced microscopes while providing research quality performance. Here we present an implementation of automated dSTORM microscopy with optical autofocus and open source software for image data acquisition and analysis. openFrame sits within our openScopes platform that aims to provide cost-effective access to advanced optical imaging techniques including high content analysis, super-resolved microscopy, quantitative phase contrast imaging and hyperspectral imaging. 


 Uncaptioned visual


Methods

Figure 1 illustrates the openFrame concept, which is designed around a cylindrical geometry that allows straightforward and precise centering of components along an optical axis and it is made up of different layers that can be customized as necessary for specific applications. The core microscope stand has been designed for straightforward manufacture using standard lathes and milling machines. openFrame has a top layer containing the objective lens that can be mounted on a low-cost piezo-motorised stage and a beam splitter that allows an infrared laser-based autofocus unit to be deployed. An excitation layer incorporating the main dichroic beamsplitter and a camera layer that includes the tube lens. An openFrame based microscope can be easily expanded with more excitation or camera layers as required and functionality can be extended using third party components. Furthermore, sample x-y drift measured during an acquisition of 5000 frames was less than 2 pixels (210 nm) during image acquisition, which is less than that observed with our commercial fluorescence microscope frame. 

Single molecule localisation microscopy (SMLM) techniques can enable super-resolved imaging with relative simple experimental configurations based on epifluorescence or total internal reflection fluorescence (TIRF) microscopes. SMLM is particularly straightforward to implement via dSTORM[1], which can utilise common fluorophores, and several groups have demonstrated low-cost dSTORM microscopes, e.g.[2],[3],[4],[5]. We have developed a robust and low-cost approach, easySTORM[3], to implement TIRF or epifluorescence SMLM on a standard inverted fluorescence microscope: this utilises a multimode optical fibre for efficient light coupling and the opportunity to average laser speckle (by vibrating fibre and mixing modes) for reasonably uniform illumination. The microscope can be adjusted between TIRF and epifluorescence by steering the excitation beam to be focused at different locations in the back focal plane of the objective lens. Combining this approach with low-cost, high-power multimode laser diodes to provide high power (~1 W) excitation, results in the easySTORM capability being realizable for a component cost of ~£7000 plus the cost of the objective lens and the camera. While these components can together cost £20,000 for state-of-the art components, we and others have shown that reasonable STORM images can be acquired in epifluorescence using low-cost objective lenses and with low-cost uncooled CMOS cameras. Here we demonstrate improved, cost effective performance with a newly available fan-cooled CMOS camera. 

Uncaptioned visual

The use of multimode diode lasers improves the uniformity of illumination and provides excitation at a cost as low as ~£500/excitation wavelength with sufficient power to undertake STORM of samples with a field of view (FOV) >120 ×120 µm2. Such large FOV result in large (>~30 GB) data files that can require significant time (tens of minutes to hours) for SMLM data processing, e.g. using ThunderSTORM[6] on a desktop computer. We therefore developed a parallelized SMLM analysis approach, initially based on ThunderSTORM implemented on a high-performance computing cluster[7], to process SMLM data from multiple FOV in parallel on different nodes in the HPC cluster or to accelerate the processing of SMLM data from one FOV by dividing the localisation task between multiple nodes. The large FOV of easySTORM combined with the scaling of SMLM data processing rate using HPC resources are key enablers for high throughput SMLM, which has previously been demonstrated with PALM[8] and STORM[9]. We have developed a low-cost open source automated SMLM high content analysis platform combining easySTORM with an optical autofocus and motorised stage-scanning to enable automated multiwell plate dSTORM acquisition. The autofocus module utilises a convolutional neural network (CNN) that can robustly determine the distance from focus by analysing a single image captured on the autofocus camera[10]. Automated dSTORM has been applied to high content super-resolved imaging, including of focal adhesions in melanoma cells and phagocytosis of bacteria. We have also explored the use of a new generation of fan-cooled CMOS cameras for SMLM, noting that the relatively high frame rate used for SMLM means that fan-cooling can provide similar SMLM performance to thermoelectric cooled sCMOS cameras, as illustrated in figure 2. 


Conclusions

We have presented an open microscopy platform applicable to most imaging modalities, including automated and super-resolved microscopy. Links to the open-source software to control the easySTORM microscope and for the scripts for the HPC processing of SMLM data will be provided at: https://www.imperial.ac.uk/photonics/research/biophotonics/instruments--software/open-source-software/. Further information concerning our open source microscopy platform can be found at www.openScopes.com

References

[1] Heilemann, M., et al,  "Subdiffraction-resolution fluorescence imaging with conventional fluorescent probes" Angewandte Chemie (International Ed. in English), 47, 6172–6176 (2008)

[2] Holm, T., et al. "A blueprint for cost-efficient localization microscopy" Chem-PhysChem. 15, 651–654 (2014).

[3] Kwakwa, K., et al.,. "easySTORM: a robust, lower-cost approach to localisation and TIRF microscopy," J. Biophotonics, 9, 948–957 (2016).

[4] Ma, H., Fu, R., Xu, J., & Liu, Y. "A simple and cost-effective setup for super-resolution localization microscopy." Scientific Reports, 7, 1542 (2017).

[5] Diekmann, R., et al., "Characterization of an industry-grade CMOS camera well suited for single molecule localization microscopy - High performance super-resolution at low cost" Scientific Reports, 7, 14425 (2017).

[6] Ovesný, et al., "ThunderSTORM: A comprehensive ImageJ plug-in for PALM and STORM data analysis and super-resolution imaging" Bioinformatics, 30, 2389–2390 (2014).

[7] Munro, I., et al., "Accelerating single molecule localization microscopy through parallel processing on a high‐performance computing cluster" J. Microscopy 273 148-160 (2019) 

[8] Holden, et al., S. "High throughput 3D super-resolution microscopy reveals Caulobacter crescentus in vivo Z-ring organization" Proc. Natl. Acad. Sci. U.S.A. 111, 4566–4571 (2014).

[9] Beghin, A., et al. "Localization-based super-resolution imaging meets high-content screening" Nature Methods, 14, 1184–1190 (2017).

[10] J. Lightley et al, "Robust optical autofocus system utilizing neural networks trained for extended range and time-course and automated multiwell plate imaging including single molecule localization microscopy" bioRxiv (2021), https://doi.org/10.1101/2021.03.05.431171 


24 The field guide to 3D-printing in microscopy

Mario Del Rosario1,2, Hannah S. Heil1,2, Afonso Mendes1,2, Vittorio Saggiomo3, Ricardo Henriques1,4
1Instituto Gulbenkian de Ciência, Oeiras, Portugal. 2These authors have contributed equally. 3Laboratory of BioNanoTechnology, Wageningen University and Research, Wageningen, The Netherlands. 4MRC Laboratory for Molecular Cell Biology, University College London, London, UK

Abstract Text

The maker movement has reached the optics labs empowering researchers to actively create and modify microscope designs and imaging accessories. Especially 3D-printing has had a disruptive impact on the field as it takes a completely different approach than conventional fabrication technologies, namely additive manufacturing, making prototyping in the lab available at low costs. Many examples of this trend are taking advantage of the easy accessibility of 3D-printing technology. For example, cheap microscopes for education are being produced, such as the FlyPi [1]. Also, the highly complex robotic microscope OpenFlexure [2] represents a clear desire for the democratisation of this technology. 3D-printing facilitates new and powerful approaches to science and promotes collaborations between researchers, as 3D designs are easily shared. 3D-printing holds the unique possibility to extend the open-access concept from knowledge to technology allowing researchers from everywhere to use and extend model structures.

Here we present a review of additive manufacturing applications in microscopy, guiding the user through this new and exciting technology and giving a starting point to anyone willing to employ this powerful and versatile new tool.

References

[1] Maia Chagas A, Prieto-Godino LL, Arrenberg AB, Baden T (2017) The €100 lab: A 3D-printable open-source platform for fluorescence microscopy, optogenetics, and accurate temperature control during behaviour of zebrafish, Drosophila, and Caenorhabditis elegans. PLOS Biology 15(7): e2002702. https://doi.org/10.1371/journal.pbio.2002702

[2] Collins JT, Knapper J, Stirling J et al. (2020) Robotic microscopy for everyone: the OpenFlexure microscope. Biomed. Opt. Express (11), 2447-2460 https://doi.org/10.1364/BOE.385729


32 Simultaneous multi-color 3D whole cell super-resolution imaging and particle tracking using engineered point spread functions

Anurag Agrawal, Warren Colomb, Scott Gaumer, Anjul Loiacono, Leslie Kimerling
Double Helix Optics

Abstract Text

Widefield fluorescence optical microscopes are the workhorse of laboratories in numerous fields – biology, medicine, and pharmacology – providing invaluable visual information and informative quantitative data. The function of bio-molecules is often inferred by comparing the behavior of different intercellular functions by labeling them with different molecules. It is therefore valuable to localize and track multiple colors simultaneously in 3D. However, currently available microscopes are often limited in their imaging depth, resolution, and ability to image different fluorophores simultaneously.


Current solutions rely on sequential imaging or an additional camera and do not provide the required flexibility to work with the recently available large sensor formats (25 mm diagonal) and the ubiquitous legacy format (11.6 mm diagonal). Furthermore, none of the existing solutions take advantage of the increased depth, speed, and 3D resolution enhancements provided by engineered PSFs[1]–[3]. Here, we present two unique solutions that overcome these limitations and enable simultaneous 3D extended depth multi-color imaging of biological samples.


We address the limitations of existing solutions in two ways. Our first solution is based on multi-color phase masks (MC-PM) [4], which uniquely identify two or more probes on the same camera sensor area by encoding the spectral information and axial position, into a distinctly-shaped PSF for each color. An example of this is shown in Fig 1 where the MC-PM encodes DH-PSFs at perpendicular orientations for two selected wavelengths.   


Our second solution is a universal modular subsystem – SPINDLE2, which can be installed between most scientific microscopes and cameras (see Figure 2). Along with a library of engineered PSFs, including MC-PMs[4], Double-Helix[1], and Tetrapod[3], the SPINDLE2 can be used with dichroic mirrors or polarizing/non-polarizing beam splitters. It is easily adjusted to work with a wide range of camera formats with no loss of resolution across the full field of view. The module features interchangeable mounts enabling users to optimize the PSF for their experiments, while allowing easy switching between single color, dual color, and bypass modes. The library of phase masks allows users to choose from a broad range of PSFs to extend the imaging depth range by 3x-30x, allowing for up to 30 µm of depth range with high numerical aperture objectives.


The unique combination of multimodal imaging and engineered PSFs has been used to extend the imaging capabilities of microscopes in the areas of nanometer-scale single-molecule imaging[1], [2], light sheet[5], 3D particle tracking [3], [4], the study of cancer[6], immunology, neuroscience[7], and more.


Uncaptioned visual

Figure 1: (a) A multicolor Double Helix mask exhibiting unique point spread functions based on the emission wavelength of the fluorophore enabling simultaneous multicolor imaging (b) Schematic of the Double Helix SPINDLE2 module showing the beam paths of each channel. The module allows for simultaneous imaging of two channels (emission spectrum based, polarization based, intensity based, etc.) on a single camera. Each imaging channel can be modulated with a point spread function from the Double Helix library of phase masks.


References

[1]         S. R. P. Pavani et al., “Three-dimensional, single-molecule fluorescence imaging beyond the diffraction limit by using a double-helix point spread function.,” Proc. Natl. Acad. Sci. U. S. A., vol. 106, no. 9, pp. 2995–9, Mar. 2009.

[2]         A. Gahlmann et al., “Quantitative multicolor subdiffraction imaging of bacterial protein ultrastructures in three dimensions.,” Nano Lett., vol. 13, no. 3, pp. 987–93, Mar. 2013.

[3]         Y. Shechtman, L. E. Weiss, A. S. Backer, S. J. Sahl, and W. E. Moerner, “Precise Three-Dimensional Scan-Free Multiple-Particle Tracking over Large Axial Ranges with Tetrapod Point Spread Functions,” Nano Lett., vol. 15, no. 6, pp. 4194–4199, Jun. 2015.

[4]         Y. Shechtman, L. E. Weiss, A. S. Backer, M. Y. Lee, and W. E. Moerner, “Multicolour localization microscopy by point-spread-function engineering,” Nat. Photonics, vol. 10, no. 9, pp. 590–594, Sep. 2016.

[5]         A.-K. Gustavsson, P. N. Petrov, M. Y. Lee, Y. Shechtman, and W. E. Moerner, “3D single-molecule super-resolution microscopy with a tilted light sheet,” Nat. Commun. 2018 91, vol. 9, no. 1, p. 123, Jan. 2018.

[6]         W. Y. Lam et al., “HER2 Cancer Protrusion Growth Signaling Regulated by Unhindered, Localized Filopodial Dynamics,” bioRxiv, p. 654988, Jun. 2019.

[7]         S. Jain, J. R. Wheeler, R. W. Walters, A. Agrawal, A. Barsic, and R. Parker, “ATPase-Modulated Stress Granules Contain a Diverse Proteome and Substructure,” Cell, vol. 164, no. 3, pp. 487–498, 2016.


62 UCsim2: Super-resolution microscopy for everyone with UC2 toolbox

Haoran Wang1,2, René Lachmann1,3, Barbora Marsikova1,3, Rainer Heintzmann1,2,3, Benedict Diederich1,2
1Leibniz Institute of Photonic Technology. 2Institute of Physical Chemistry and Abbe Center of Photonics, Friedrich-Schiller-University. 3Faculty of Physics and Astronomy, Friedrich-Schiller-University

Abstract Text

Introduction:

This work demonstrates a compact multimodal setup based on a previously presented open-source optical toolbox UC2 [1] that combines two different super-resolution microscopy methods, image scanning microscopy (ISM) and structured illumination microscopy (SIM). 

In this work, a new injection-moulded (IM) version of the UC2 toolbox is presented, which allows infinitely extending the baseplate with “puzzle”-like mapping mechanism in X/Y direction and “sandwich”-like stacking manner of multiple layers in Z direction. Injection-molding provides higher long-term stability and lower fabricating tolerances comparing to 3D printing. The IM version is downward-compatible with 3D-printed cubes which provides more possibility to assemble different-sized optical and electrical components into the setup.

The ISM and SIM can be realized in the UC2 framework at a low price and in a simplified setup benefited from consumer-grade laser video projector and open-source digital mirror device (DMD). The setup is used to imaging Alexa Flour 647(AF647)- and Silicon Rhodamine(SiR)-stained HeLa cells. The resolution of the system is determined as  and the total cost of the setup is down to ~2k€. The project information is open-accessed, devices as well as assembly details are available in the GitHub repository[2]. With the UC2 ecosystem, everyone can build their super-resolution microscopes in a low-cost way.

Uncaptioned visual

References

[1]       B. Diederich et al., “A versatile and customizable low-cost 3D-printed open standard for microscopic imaging,” Nat. Commun., vol. 11, no. 5979, pp. 1–9, 2020, doi: 10.1038/s41467-020-19447-9.

[2]       B. Diederich, R. Lachmann, H. Wang, and B. Marsikova, “UC2 Github Hardware Repository,” 2019. https://github.com/bionanoimaging/UC2-GIT/tree/master/APPLICATIONS.


80 Qualitative/Quantitative MINFLUX beyond the 1-nm resolution

Kirti Prakash
National Physical Laboratory, London, UK

Abstract Text

Gwosch et al. (2020) and Balzarotti et al. (2017) purport MINFLUX as the next revolutionary fluorescence microscopy technique claiming a spatial resolution in the range of 1-3 nm in fixed and living cells. Though the claim of molecular resolution is attractive, I am concerned whether true 1 nm resolution has been attained. Here, I compare the performance with other super-resolution methods focussing particularly on spatial resolution claims, atypical image rendering, visualisation enhancement, subjective filtering of localizations, detection vs labelling efficiency and the possible limitations when imaging biological samples containing densely labelled structures. I hope the analysis and evaluation parameters presented here are not only useful for future research directions but also for microscope users, developers and core facility managers when deciding on an investment for the next 'state-of-the-art' instrument.

Uncaptioned visual


References


88 Quantitative super-resolution microscopy unravels nanoscale patterns of membrane receptor networks

Marina S. Dietz, Yunqing Li, Claudia Catapano, Mark S. Schröder, Johanna V. Rahm, Tim N. Baldering, Marie-Lena I.E. Harwardt, Christos Karathanasis, Mike Heilemann
Institute of Physical and Theoretical Chemistry, Goethe-University Frankfurt, 60438 Frankfurt, Germany

Abstract Text

Macromolecular protein complexes that form in the cell membrane are the “communication hubs” of a cell to its environment. Triggered by ligands, cell-cell contact, or pathogens, membrane receptors form complexes of specified composition and function, thereby encoding external stimuli into information that is processed by the cell. This often involves the formation of protein assemblies that constitute through weak interactions of multivalent membrane-associated proteins. The complexity and heterogeneity of these protein assemblies demand for imaging methods that can achieve molecular resolution as well as read out the heterogeneity of such assemblies in the plasma membrane and that can operate in a native and unperturbed state of a cell. 

We determine the composition of membrane protein assemblies directly in cells by developing and applying tools for multi-protein super-resolution microscopy and quantitative image analysis including DNA-based point accumulation for imaging in nanoscale topography (DNA-PAINT), photoactivated localization microscopy (PALM), and single-particle tracking.[1] With this toolbox, we visualize the organization of membrane receptor assemblies in the plasma membrane of cells and follow the dynamics of their assembly.[2-5] We study protein assemblies of receptor tyrosine kinases including members of the MET, the EGFR, and the FGFR family, their modulation through ligands, and their interaction with other membrane-associated proteins. The imaging and analysis technology is transferable to other multi-protein networks in cells and will help to understand the principles of molecular organization in the plasma membrane.  

References

[1] Dietz, M.S. and Heilemann, M. (2019) Optical super-resolution microscopy unravels the molecular composition of functional protein complexes. Nanoscale.

[2] Harwardt, M.-L.I.E. et al. (2020) Single-molecule super-resolution microscopy reveals heteromeric complexes of MET and EGFR upon ligand activation. IJMS 21, 2803.

[3] Schröder, M.S., Harwardt, M.-L.I.E., Rahm, J.V., Li, Y., Freund, P., Dietz, M.S. and Heilemann, M. (2020) Imaging the fibroblast growth factor receptor network on the plasma membrane with DNA-assisted single-molecule super-resolution microscopy. Methods. DOI: 10.1016/j.ymeth.2020.05.004.

[4] Baldering, T.N. et al. (2021) CRISPR/Cas12a-mediated labeling of MET receptor enables quantitative single-molecule imaging of endogenous protein organization and dynamics. iScience 24, 101895. 

[5] Karathanasis, C. et al. (2020) Single-molecule imaging reveals the oligomeric state of functional TNFa-induced plasma membrane TNFR1 clusters in cells. Science signaling 13, eaax5647.


28 Application of low-cost stochastic optical reconstruction microscopy to the histological analysis of human glomerular disease

Edwin Garcia1, Jonathan Lightly1, Sunil Kumar1,2, Ranjan Kalita1, Frederik Görlitz1, Yuriy Alexandrov1,2, Terence Cook1, Christopher Dunsby1,2, Mark Neil1,2, Candice Roufosse1, Paul French1,2
1Imperial College London. 2Francis Crick Institute

Abstract Text

Summary

Electron microscopy (EM) is used for diagnosis in human glomerular diseases in the UK and elsewhere but diagnostic EM is not available in many countries. Single molecule localisation microscopy (SMLM) can extend conventional immunofluorescence of stained tissue to resolution near EM. We are exploring the diagnostic value of easySTORM, our low-cost implementation of dSTORM, applied to standard histological sections of frozen and paraffin-embedded clinical kidney samples. 

Introduction

Electron microscopy (EM) following immunofluorescence (IF) imaging is established in the UK for the diagnosis of human glomerular diseases but the implementation of EM is limited to specialised institutions and it is not available in many countries. We have applied easySTORM [1] , our low-cost implementation of dSTORM [2] to upgrade a standard widefield fluorescence microscope to provide immunofluorescence images with resolution below 50 nm starting from standard histological sections from human kidney biopsies - both frozen and formalin-fixed and paraffin-embedded (FFPE) – to explore whether this may provide an alternative to EM for diagnosing kidney disease. We have developed a workflow that we designate “histoSTORM”, utilising clinically approved immunofluorescent probes for the basal laminae and immunoglobulin G deposits and have compared this approach to clinical electron microscopy images. We demonstrate enhanced imaging compared to conventional immunofluorescence microscopy for cases of membranous glomerulonephritis, thin basement membrane lesion and lupus nephritis. Thus minor modifications of established immunofluorescence protocols for clinical renal biopsies may enable a cost-effective alternative to EM to aid diagnosis of human glomerular disease.  

Methods

“histoSTORM”: immunofluorescence staining was carried out on frozen and formalin-fixed paraffin embedded (FFPE) tissue from renal biopsies with Membranous glomerulonephritis (MGN), Lupus nephritis and Minimal change disease. Staining was performed for IgG documented with ifluor 647 and for Glomerular Basement Membrane (GBM) laminin documented with Alexa Fluor 555 using antibodies in routine clinical use. dSTORM of these tissue sections was undertaken using our open source easySTORM adaptation of a conventional fluorescence microscope.

“histoSTORM” was applied to immunofluorescence of both FFPE and frozen histological sections using standard clinically approved antibodies. The super-resolved immunofluorescence images rendered at 25 nm per pixel reveal well-defined subepithelial deposits in MGN and enlargement of the GBM that are consistent with those observed by EM. In a case of stage IV lupus nephritis, mesangial, subendothelial and subepithelial IgG deposits are readily observed with histoSTORM and recapitulate the distribution of electron dense IgG deposits documented with EM. histoSTORM also enables GBM thickness measurements on paraffin-embedded tissue with resolution below diffraction in a case of Minimal change disease.

Uncaptioned visual

A-I: Basement membrane (laminin, green – Alexa Fluor 555), Immunoglobulin G deposits (IgG, red – iFluor 647). A-B. Widefield immunofluorescence images at 20x magnification of frozen section of Membranous Glomerulonephritis showing A: laminin channel, 
B: IgG channel, and C: expanded two-channel image at 100X magnification of region indicated by yellow square in A and B; 
D: Widefield immunofluorescence of region indicated by yellow square in C; and 
E: corresponding STORM image with pixel size rendered at 25 nm. 
F:  Electron micrograph of similar structure from same biopsy at 20,200x magnification. 
G: Widefield immunofluorescence image of 3.2 x 2.4 µm2 region indicated in D,E with H: corresponding STORM image; 
I: expanded electron micrograph image of region indicated in F. Yellow dashed lines indicate the light grey glomerular basement membrane. Dark grey electron-dense deposits on the sub-epithelial side (purple arrows) represent immune complexes containing IgG.

J-P: Glomerular Basement Membrane (Laminin-iFluor 647) 
J: Widefield immunofluorescence image at 100x magnification of FFPE section 
K: Rendered STORM image of region shown in J. L: Widefield inset of a region shown in J. M: STORM inset of region shown in K rendered with a pixel size of 25 nm. 
N: Electron micrograph of a GBM from different section of same biopsy 60,700x magnification, for which the GBM thickness at indicated position is 281 nm. 
O: Presenting measured thickness (full width at half maximum) of GBM from wide-field immunofluorescence image C line profile (657 nm)  
P:  Measured thickness (FWHM) of STORM image M at line profile (212 nm).

Figure adapted from reference [3]. 


Conclusions

While this study [3] does not establish that histoSTORM can fully replace EM in renal diagnosis, it does provide evidence of added value relative to Light Microscopy and IF. The large (dSTORM) field of view (120 µm square) and standard sample preparation make it more convenient than EM (as well as more affordable). However, prospective studies of large case series are required to establish its clinical utility. histoSTORM may not be able to replace EM for all renal diagnoses but it may have potential for wide clinical impact, especially in less well-resourced settings where EM is not available. We note that STORM has previously been applied to research pathology, e.g. to study epigenetic modulation [4] and the progression of cancer [5] but not to clinical histological sections using clinically approved antibodies, to the best of our knowledge. 


References

[1] Kwakwa, K., et al.,. “easySTORM: a robust, lower-cost approach to localisation and TIRF microscopy,” J. Biophotonics, 9, 948–957 (2016).

 [2] Heilemann, M., et al.,  Subdiffraction-resolution fluorescence imaging with conventional fluorescent probes. Angewandte Chemie (International Ed. in English), 47, 6172–6176 (2008)

 [3] E. Garcia et al., “Application of direct Stochastic optical reconstruction microscopy to the histological analysis of human glomerular disease”, J Pathology: Clinical Research, in press

[4]  Xu J, Ma H, et al., Super-Resolution Imaging of Higher-Order Chromatin Structures at Different Epigenomic States in Single Mammalian Cells. Cell Reports 24 (2018) 873-882.

[5]  Xu J, et al., Super-resolution imaging reveals the evolution of higher-order chromatin folding in early carcinogenesis. Nature Communications 11 (2020) 1899.


86 Exchangeable fluorophore labels in super-resolution fluorescence microscopy

Marius Glogger1, Christoph C. Spahn2, Marko Lampe3, Jörg Enderlein4, Mike Heilemann1
1Institute of Physical and Theoretical Chemistry, Goethe-University Frankfurt, 60438 Frankfurt, Germany. 2Max Planck Institute for Terrestrial Microbiology, 35043 Marburg, Germany. 3Advanced Light Microscopy Facility, European Molecular Biology Laboratory, Meyerhofstr. 1, 69117 Heidelberg, Germany. 4Third Institute of Physics - Biophysics, University of Göttingen, 37077 Göttingen, Germany

Abstract Text

We present fluorophore labels that transiently and repetitively bind to their targets as probes for various types of super-resolution fluorescence microscopy. Transient labels typically show a weak affinity to a target, and exchange constantly with the buffer that constitutes a reservoir with a large amount of intact probes, leading to repetitive binding events to the same target (we refer to these labels as “exchangeable labels”). This dynamic labeling approach is insensitive to common photobleaching and yields a constant fluorescence signal over time, which has been successfully exploited in SMLM [1-3], STED [4, 5], single-particle tracking [6] and super-resolution optical fluctuation imaging (SOFI) [7]. We discuss properties of suitable exchangeable labels, experimental parameters for optimal performance for the different super-resolution methods, and present high-quality multicolor super-resolution imaging.

References

1.            Jungmann, R., et al., Single-molecule kinetics and super-resolution microscopy by fluorescence imaging of transient binding on DNA origami. Nano Lett, 2010. 10(11): p. 4756-61.

2.            Sharonov, A. and R.M. Hochstrasser, Wide-field subdiffraction imaging by accumulated binding of diffusing probes. Proc Natl Acad Sci U S A, 2006. 103(50): p. 18911-6.

3.            Spahn, C.K., et al., A toolbox for multiplexed super-resolution imaging of the E. coli nucleoid and membrane using novel PAINT labels. Sci Rep, 2018. 8(1): p. 14768.

4.            Spahn, C., et al., Whole-Cell, 3D, and Multicolor STED Imaging with Exchangeable Fluorophores. Nano Lett, 2019. 19(1): p. 500-505.

5.            Spahn, C., et al., Protein-Specific, Multicolor and 3D STED Imaging in Cells with DNA-Labeled Antibodies. Angew Chem Int Ed Engl, 2019. 58(52): p. 18835-18838.

6.            Harwardt, M.I.E., et al., Single-Molecule Super-Resolution Microscopy Reveals Heteromeric Complexes of MET and EGFR upon Ligand Activation. Int J Mol Sci, 2020. 21(8).

7.            Dertinger, T., et al., Fast, background-free, 3D super-resolution optical fluctuation imaging (SOFI). Proc Natl Acad Sci U S A, 2009. 106(52): p. 22287-92.


183 PatchPerPixMatch for Automated 3D Search of Neuronal Morphologies in Light Microscopy

Lisa Mais1, Peter Hirsch1, Claire Managan2, Kaiyu Wang2, Konrad Rokicki2, Robert R. Svirskas2, Barry Dickson2, Wyatt Korff2, Gerry Rubin2, Gudrun Ihrke2, Geoffrey Meissner2, Dagmar Kainmueller1
1Max Delbrück Center for Molecular Medicine. 2HHMI Janelia Research Campus

Abstract Text

We propose PatchPerPixMatch, a fully automated method for finding a given neuron morphology in 3d multi-color light microscopy images.

The brain of the fruit fly Drosophila Melanogaster offers a unique opportunity for biologists to yield a mechanistic understanding of behavior on the level of individual neurons and their synaptic connections. In order to visualize and manipulate targeted neurons, an effective set of cell-type specific transgenic lines as well as different imaging modalities are the current tools of choice. In both parts, neuron matching, which aims at identifying the same neuron in different microscopy images, has an important role to play. Matching neurons from electron to light microscopy images enables to combine information about neuronal function and connectivity, whereas finding overlapping expression patterns in light microscopy data can be used to push the creation of new cell-type specific transgenic lines (split GAL4 system).

In the FlyLight project of HHMI Janelia Research Campus, the imaging is done by multi-color flip-out (MCFO), a stochastic labeling able to express different densities of neurons. As neurons span across large parts of the image, are intertwined and may overlap due to partial volume effects, manual matching is very time consuming and infeasible at great scale. PatchPerPixMatch tackles this problem by providing a fully automated pipeline to find a given neuronal structure in 3d MCFO acquisitions. Firstly, it performs a deep-learning based instance segmentation using PatchPerPix and subsequently searches for a target neuron morphology by minimizing an objective that aims at covering the target with a set of well-fitting segmentation fragments.

Thus, PatchPerPixMatch is computationally efficient albeit being full 3d, while also highly robust to inaccuracies in the automated neuron instance segmentation. We generated PatchPerPixMatch search results for ∼30,000 neuron morphologies from the Drosophila central brain connectome reconstructed from electron microscopy (Janelia's FlyEM project) in ∼20,000 MCFO acquisitions of ∼3,500 transgenic lines.


References

Mais, L., Hirsch, P., Kainmueller, D.: PatchPerPix for instance segmentation. Lecture Notes in Computer Science 12370, 288–304 (2020)

Meissner, G.W., Dorman, Z., Nern, A., Forster, K., Gibney, T., Jeter, J., Johnson, L., He, Y.,Lee, K., Melton, B., et al.: An image resource of subdivided drosophila gal4-driver expression patterns for neuron-level searches. BioRxiv (2020)

Xu, C.S., Januszewski, M., Lu, Z., Takemura, S.y., Hayworth, K., Huang, G., Shinomiya,K., Maitin-Shepard, J., Ackerman, D., Berg, S., et al.: A connectome of the adult drosophila central brain. BioRxiv (2020)